![]() Figures F1-F30
Figures F1-F30
![]() Tables
T1-T11
Tables
T1-T11
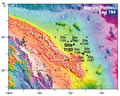
F1. Bathymetry map.
F2. Lithologic summary.
F3. Close-up photograph of Teichichnus ichnofossil, Chondrites ichnofossil, and firmground.
F4. Color reflectance and calcium carbonate content data.
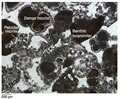
F5. Unit I microfacies.
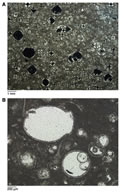
F6. Subunit IIA microfacies.
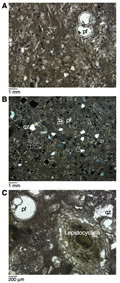
F7. Unit III microfacies.
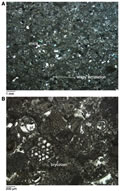
F8. Unit IV microfacies.
F9. Long-core measurements, Hole 1192A.
F10. Long-core measurements, Hole 1192B.
F11. Long-core measurements showing interpreted reversal sequence, Hole 1192B.
F12. Stereographic plot of directions of magnetization.
F13. Core-top anomalies.
F14. Remanent magnetic characteristics.
F15. Variation downcore of ARM and IRM, ARM/IRM, and ratio of IRM.
F16. Age-depth model and sedimentation rates.
F17. Dissolved constituents.
F18. Dissolved magnesium vs. calcium.
F19. Dissolved magnesium vs. sulfate.
F20. Carbon, hydrogen index, and sulfur.
F21. GRA bulk density.
F22. Bulk density, grain density, and porosity.
F23. P-wave velocity.
F24. Average thermal conductivity.
F25. Crossplot of porosity and thermal conductivity.
F26. Comparison of physical properties.
F27. NGR data.
F28. Depth offset between Holes 1192A and 1192B.
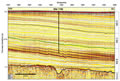
F29. Multichannel line MAR20.
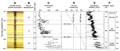
F30. Synthetic seismogram, seismic megasequence definition, P-wave velocity, two-way traveltime to depth conversion, bulk density, lithologic units, and ages.
T1. Coring summary.
T2. Expanded coring summary.
T3. Table defining major lithologic units.
T4. Biostratigraphic datums.
T5. Magnetostratigraphic results.
T6. Age-depth control points.
T7. Interpolated ages of lithologic unit boundaries.
T8. Headspace gas composition.
T9. Interstitial water chemistry.
T10. Carbon, nitrogen, sulfur, and hydrogen values.
T11. Rock-Eval pyrolysis results.