![]() Figures F1-F54
Figures F1-F54
![]() Tables
T1-T13
Tables
T1-T13
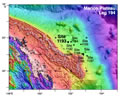
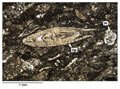
F1. Bathymetry map.
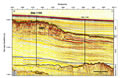
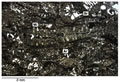
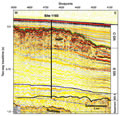
F2. Seismic line MAR13.
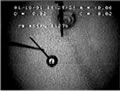
F3. Reentrance of Hole 1193B with ACDB bit.
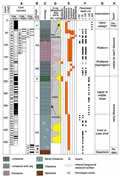
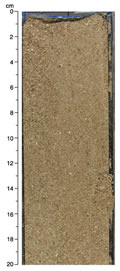
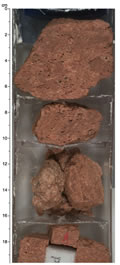
F4. Lithostratigraphic summary.
F5. Close-up photograph of grainstone bed.
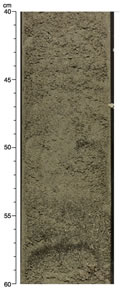
F6. Close-up photograph of the base of Unit II.
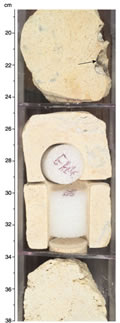
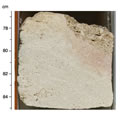
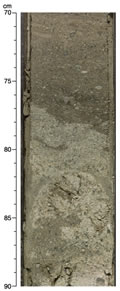
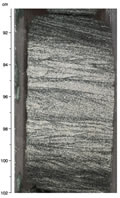
F7. Close-up photograph showing the top of Subunit IIIA.
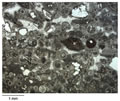
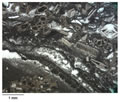
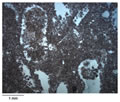
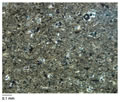
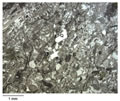
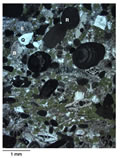
F8. Photomicrograph showing the lithology of Subunit IIIA.
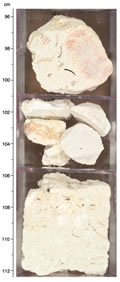
F9. Close-up photograph showing lithologies, Subunit III.
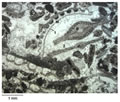
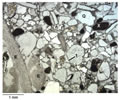
F10. Photomicrograph showing the white, variably porous rudstone to floatstone.
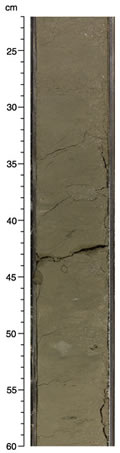
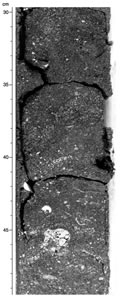
F11. Close-up photograph of a fracture through skeletal packstone.
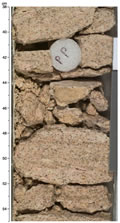
F12. Close-up photograph showing skeletal rudstone.
F13. Close-up photograph showing dolomitized rudstone.
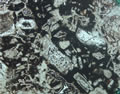
F14. Photomicrograph of dolomitized rudstone in Subunit IIIA.
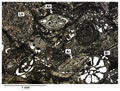
F15. Photomicrograph showing a lithology from Subunit IIIB.
F16. Close-up photograph of floatstone/mudstone interval.
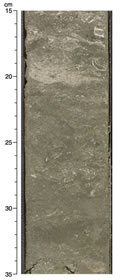
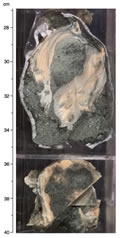
F17. Close-up photograph of Unit IV.
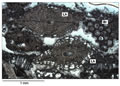
F18. Photomicrograph showing a lithology from Unit IV.
F19. Close-up photograph of Unit V.
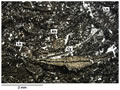
F20. Photomicrograph showing silt- to fine sand-sized packstone.
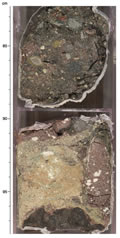
F21. Close-up photograph of contact between Units V and VI.
F22. Close-up photograph of skeletal grainstone.
F23. Photomicrograph showing a typical carbonate lithology.
F24. Photomicrograph showing a sandstone from Subunit VIA.
F25. Close-up photograph of the deepest core in Subunit VIA.
F26. Photomicrograph from the deepest core in Subunit VIA.
F27. Close-up photograph showing the upper part of Subunit VIB.
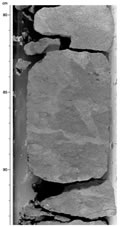
F28. Close-up photograph showing acoustic basement of Unit VII.
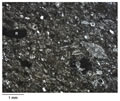
F29. Photomicrograph from Unit VII.
F30. Vertical sections of Amphistegina hauerina and A. radiata.
F31. Vertical sections of two L. howchini specimens.
F32. Vertical section of Cyclocypeus sp.
F33. Vertical section of Operculina complanata.
F34. Vertical sections through two Miogypsina sp.
F35. Long-core measurements of intensity and inclination.
F36. Stereographic plot of directions of magnetization.
F37. Examples of Zijderveld diagrams.
F38. ARM results.
F39. IRM acquisition results.
F40. Thermal demagnetization results of IRM showing two antiparallel directions.
F41. Thermal demagnetization results of IRM showing two components with similar directions.
F42. Age-depth model and sedimentation rates.
F43. Dissolved constituents vs. depth.
F44. Dolomite, calcite, and noncarbonate mineral percentages.
F45. Carbon, HI, and sulfur plots.
F46. GRA and MAD bulk density, grain density, and porosity.
F47. P-wave velocity.
F48. Crossplot of velocity vs. porosity.
F49. Average thermal conductivity.
F50. Crossplot of thermal conductivity vs. porosity.
F51. Magnetic susceptibility, and natural gamma radiation as a function of depth.
F52. Bulk density, magnetic susceptibility, and natural gamma radiation, 0 to 35 mbsf.
F53. Multichannel line MAR13.
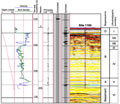
F54. Synthetic seismogram plotted on line MAR13 and core-to-seismic correlation.
T1. Coring summary.
T2. Expanded coring summary.
T3. Lithologic units.
T4. Nannofossil and planktonic foraminifer datums.
T5. Summary of biostratigraphic and paleoenvironmental interpretations.
T6. Magnetic polarity transitions.
T7. Age-depth control points.
T8. Age picks.
T9. Headspace gas composition.
T10. Interstitial water chemistry.
T11. Aragonite, calcite, dolomite, and noncarbonate mineral percentages.
T12. Carbon, nitrogen, sulfur, and hydrogen results.
T13. Rock-Eval analyses results.