![]() Figures F1-F50
Figures F1-F50
![]() Figures F51-F100
Figures F51-F100
![]() Figures
F101-F118
Figures
F101-F118
![]() Tables
T1-T22
Tables
T1-T22
F101. MEG-195 system block diagram.
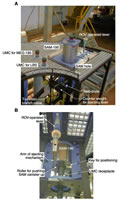
F102. MEG-195 vessel installed in the MEG frame.
F103. Allocation of the UMCs on the MEG vessel.
F104. Time difference between the MEG-195 and the SAM-195.
F105. Usage of flash memory in the SAM-195.
F106. Temperature in the SAM-195 and MEG-195 pressure vessels.
F107. Supply voltage at the MEG-195 and SAM-195.
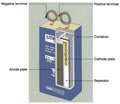
F108. Structure of a manganese dioxide/lithium primary battery.
F109. Variation of the voltage of the CL-1300L cell.
F110. Voltage of the CL-1300L cell at constant loads.
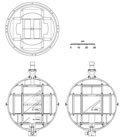
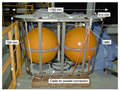
F111. Schematic of the titanium sphere.
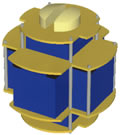
F112. Perspective view of lithium cells and rack.
F113. Block diagram of a lithium battery system unit.
F114. LBU during assembly.
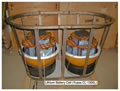
F115. Photograph of the LBU.
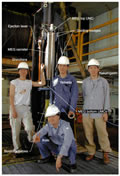
F116. PAT in the moonpool area.
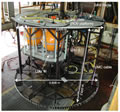
F117. Top of the PAT-195 and the recorder frame.
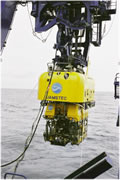
F118. Photograph of JAMSTEC's ROV, the Kaiko.
T1. Coring summary, Site 1201.
T2. XRD data for soft sediments and sedimentary rocks.
T3. XRD data on selected basement samples.
T4. Major, minor, and trace element content.
T5. Distribution of calcareous nannofossils.
T6. Estimated ages of nannofossil datum levels.
T7. Compilation of magnetostratigraphy.
T8. Composition of interstitial water.
T9. Composition of basal sediment and lithogenous pelagic clay.
T10. Mineral saturation indices vs. depth.
T11. Index properties of discrete samples.
T12. Physical properties.
T13. Logging operations summary.
T14. Logging data quality summary.
T15. Glossary of the NEREID-195 system.
T16. Sensor sensitivity of Guralp seismometer.
T17. Mapping between sensor channels and stream ID in GCF.
T18. Status messages from the CRM in the MEG/SAM.
T19. Available command set in the CRM, OBH, and SAM.
T20. Pin assignments of the UMCs.
T21. Recording configuration and data amount estimation.
T22. Power consumption of the NEREID-195 system.
![]() Figures F1-F50
Figures F1-F50
![]() Figures F51-F100
Figures F51-F100
![]() Figures F101-F118
Figures F101-F118
![]() Tables T1-T22
Tables T1-T22