![]() Figures F1-F50
Figures F1-F50
![]() Figures
F51-F100
Figures
F51-F100
![]() Figures
F101-F118
Figures
F101-F118
![]() Tables
T1-T22
Tables
T1-T22
F51. Concentration-dependent parameters and magnetic grain-size proxy.
F52. IRM and backfield acquisition curves.
F53. Magnetic intensity as a function of increasing AF field.
F54. Thermal demagnetization data from sediment and basalt.
F55. Magnetic susceptibility, intensity, and inclination.
F56. Vector component diagram with normalized intensity decay plots.
F57. Magnetostratigraphic record from 0 to 509 mbsf.
F58. Age model and correlation of the composite magnetic polarity.
F59. Demagnetization behavior of representative basalt samples.
F60. Magnetic inclinations of discrete basalt samples.
F61. Major anions and cations compared with seawater.
F62. Interstitial water pH, alkalinity, ammonia, sulfate, and chlorinity.
F63. Interstitial water Mg, Ca, Na, and K.
F64. Interstitial water Si, Sr, Mn, and F.
F65. Interstitial water Li, B, and Al.
F66. Compiled MST results, Holes 1201B and 1201D.
F67. MST results in Holes 1201B and 1201D (0-100 mbsf).
F68. MST results, Hole 1201D (100-200 mbsf).
F69. MST results, Hole 1201D (200-300 mbsf).
F70. MST results, Hole 1201D (300-400 mbsf).
F71. MST results, Hole 1201D (400-500 mbsf).
F72. MST results, Hole 1201D (500-591 mbsf).
F73. MST results, Holes 1201B and 1201C.
F74. Magnetic susceptibility, Hole 1202D.
F75. Density, porosity, velocity, and acoustic impedance.
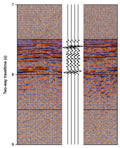
F76. Comparison of the seismic record to a synthetic trace.
F77. Seismic velocity anisotropy from velocity measurements.
F78. Peak shear strength in pelagic muds.
F79. Formation factor, Holes 1201A and 1201B.
F80. Thermal conductivity.
F81. Temperature measurements, Hole 1201C.
F82. Logging operations diagram.
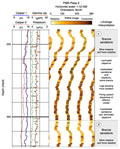
F83. Downhole logging results.
F84. Natural gamma ray logs.
F85. Pressure and temperature from the TAP tool.
F86. FMS images from a coarse turbidite-laminated claystone.
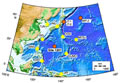
F87. Seismic station coverage in the Philippine Sea.
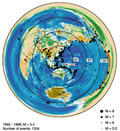
F88. Location of the WP-1 observatory in relation to global seismicity.
F89. Schematic view of the NEREID-195 system.
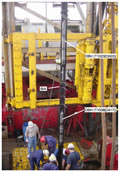
F90. BIA installation schematic.
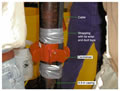
F91. Cable strappings and centralizer.
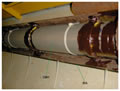
F92. BIA with two OBHs.
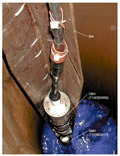
F93. An OBH sensor was emplaced on the BIA.
F94. BIA with two OBHs is lowered to the sea.
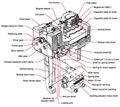
F95. Components of the OBH.
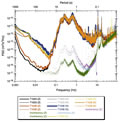
F96. Spectra of the instrument ground and self-noise.
F97. Cutaway drawing of the CMG-1T vertical sensor.
F98. Schematic diagram for the CMG-1T sensors.
F99. Seismometer clock offset and drift.
F100. Schematic diagram of the DM24 digitizer.
![]() Figures F1-F50
Figures F1-F50
![]() Figures F51-F100
Figures F51-F100
![]() Figures
F101-F118
Figures
F101-F118
![]() Tables
T1-T22
Tables
T1-T22