![]() Figures F1-F62
Figures F1-F62
![]() Tables
T1-T2
Tables
T1-T2
F1. Locations of Emperor Seamount sites.
F2. Hotspot motion and predicted motion of the Hawaiian plume.
F3. Inclination group models for Detroit Seamount.
F4. Distance from the 43-Ma bend in the hotspot track vs. age.
F5. Gauss coefficients and paleointensity determinations.
F6. Changes in Hawaiian hotspot magmas through time.
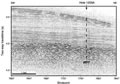
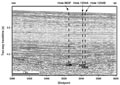
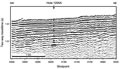
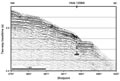
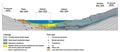
F7. Site 1203 survey 1, Line 6, migrated time section.
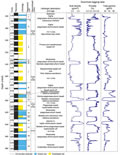
F8. Site 1203 basement rocks and biostratigraphic ages compared to logging data.
F9. Partially altered glassy lobe margins with calcareous interlobe sediment.
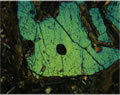
F10. Zonation in plagioclase.
F11. Olivine-rich zone.
F12. Total alkali content vs. SiO2 plots.
F13. Ti/Zr abundance ratio vs. depth, Hole 1203A.
F14. LOI, CaO, K2O, Na2O, Ba, and Sr vs. depth.
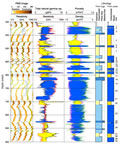
F15. Logging data summary, Hole 1203A.
F16. FMS images and wireline measurements vs. core-derived lithology.
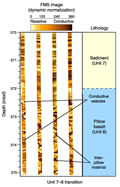
F17. FMS image of the basement Unit 7-8 transition.
F18. Downhole and uphole run of the Goettingen Borehole Magnetometer.
F19. Stable magnetic behavior in Site 1203 volcaniclastic sediment.
F20. Stable magnetic behavior in Site 1203 basalt.
F21. Inclination values derived from Hole 1203A volcaniclastic sediment.
F22. Inclination values derived from Hole 1203A basement basalt.
F23. Site 1204 survey 2, Line 3, migrated time section.
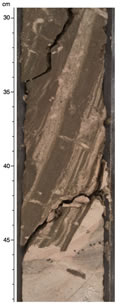
F24. Rotated, broken sediment block overlying thin, faulted, very finely laminated bed.
F25. Recovery, age, and lithology of basement units, Holes 1204A and 1204B.
F26. Breccia with altered glass and vesicular basalt in carbonate cement.
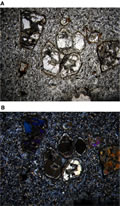
F27. Unaltered olivine and plagioclase laths in glassy lobe margin.

F28. Unaltered olivine and plagioclase laths in glassy lobe margin.

F29. Ti vs. Zr for Detroit Seamount lavas.
F30. Stable magnetic behavior in Hole 1204B basalt.
F31. Stable magnetic behavior in Hole 1204B diabase.
F32. Site 1205 survey 3, Line 4, migrated time section.
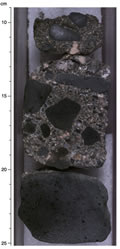
F33. Conglomerate with hawaiite clasts in fossiliferous sandy matrix.
F34. Recovery, thickness, composition, and lithology of Hole 1205A basement.
F35. Strain bands in trachytic texture.
F36. Total alkali content vs. SiO2 plot for Nintoku Seamount.
F37. Abundance of Y and Zr/Y vs. Zr.
F38. Lowrie-Fuller tests on Site 1205 basalt samples.
F39. Calculation of coercivity of remanence from Hole 1205A basalt.
F40. Stable magnetic behavior in Site 1205 basalt.
F41. Inclination values derived from Site 1205 lava flows.
F42. Site 1206 survey 4, Line 6, finite-difference migrated time section.
F43. Recovery, thickness, composition, and lithology of Hole 1206A basement.
F44. Euhedral olivine with unaltered interior and altered rims.
F45. Total alkali vs. SiO2 for Koko Seamount basaltic lava flows.
F46. Na2O, K2O, TiO2, CaO, Al2O3, and Zr vs. MgO.
F47. Lowrie-Fuller tests on Site 1206 lava flow samples.
F48. Calculation of coercivity of remanence on Hole 1206A lava flows.
F49. Stable magnetic behavior in Site 1206 basalt.
F50. Inclination values derived from Site 1206 lava flows.
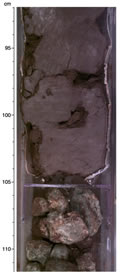
F51. Red-brown soil containing planar laminations.
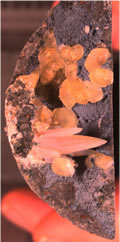
F52. Well-formed zeolites from Nintoku Seamount.
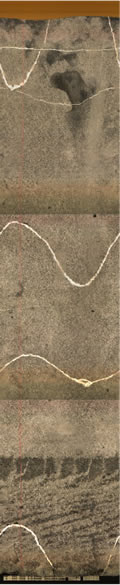
F53. DMT image of dipping veins showing sinusoidal pattern.
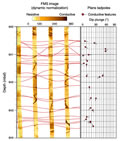
F54. Fractures and veins seen in FMS images.
F55. Rotation about the vertical axis for the magnetometer tool, Site 1203.
F56. Inferred volcanic environments at Detroit, Nintoku, and Koko Seamounts.
F57. Total alkalis vs. SiO2 for Detroit, Nintoku, and Koko Seamounts.
F58. Ti/Zr and alkalinity vs. depth in basalt from Detroit, Nintoku, and Koko Seamounts.
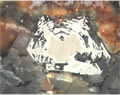
F59. Olivine phenocryst with Cr spinel inclusion.
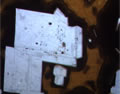
F60. Melt inclusions in plagioclase phenocrysts.
F61. Titanomagnetite showing replacement by maghemite.
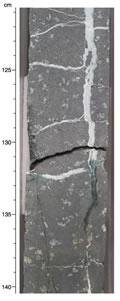
F62. Complex vein filling.
T1. Coring summary, Leg 197.
T2. Operations summary, Leg 197.