![]() Figures F1-F63
Figures F1-F63
![]() Tables
T1-T17
Tables
T1-T17
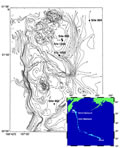
F1. Site 1204 location map.
F2. Hole 1204A components vs. magnetic susceptibility.
![]()
F3. Hole 1204B components vs. magnetic susceptibility.
F4. Lithologies observed at Site 1204.
F5. Calcareous nannofossil zones.
F6. Recovery, age, and lithology of basement.
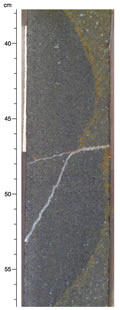
F7. Altered glass and vesicular basalt in carbonate cement.
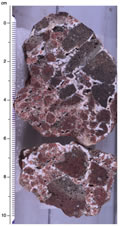
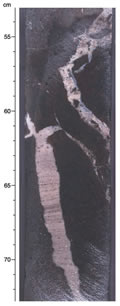
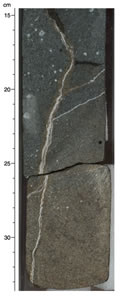
F8. Laminated carbonate sand filling joints in basalt lobes.
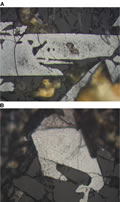
F9. Optical zonation in a plagioclase phenocryst.
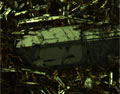
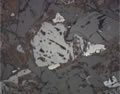
F10. Olivine pseudomorphed by Fe oxyhydroxide and goethite.
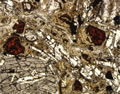
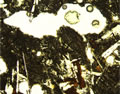
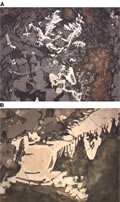
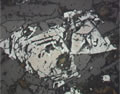
F11. Unaltered olivine and plagioclase in glassy lobe margin.
F12. Another view of unaltered olivine and plagioclase in glassy lobe margin.

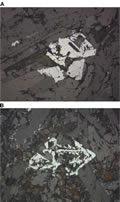
F13. Unaltered olivine with melt inclusions and plagioclase in glassy lobe margin.
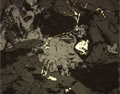
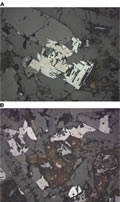
F14. Clinopyroxene partially enclosing plagioclase.

F15. Pink clinopyroxene partially enclosing plagioclase.
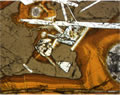
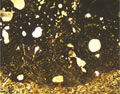
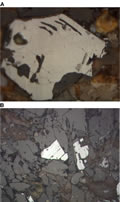
F16. Clinopyroxene and titanomagnetite on margin vesicle.
F17. Vesicle cylinder with clinopyroxene and titanomagnetite.
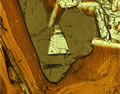
F18. Unaltered titanomagnetite and pyrite in reducing alteration zone.
F19. Titanomagnetite with coronas of maghemite.
F20. Titanomagnetite replacement by maghemite.
F21. Titanomagnetite replaced by maghemite.
F22. Relict titanomagnetite with maghemite coronas.
F23. Maghemite replacement of titanomagnetite.
F24. Maghemite exsolving ulvöspinel or ilmenite.
F25. Maghemite before replacement of titanomagnetite.
F26. Alkali vs. SiO2 plot.
F27. TiO2 vs. MgO.
F28. CaO vs. loss on ignition.
F29. Ti vs. Zr.
F30. Y, P, Sr, and Ba vs. Zr.
F31. Alteration minerals and vein and vesicle fillings, Hole 1204A.
F32. Alteration minerals and vein and vesicle fillings, Hole 1204B.
F33. Contact between oxidizing and reducing zones.
F34. Another oxidizing/reducing zone contact.
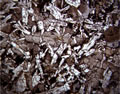
F35. Megavesicle filled with saponite and pyrite.
F36. LOI, K2O, Cu/Zr, Co/Zr, and Zn/Zr, Hole 1204A.
F37. LOI, K2O, Cu/Zr, Co/Zr, and Zn/Zr, Hole 1204B.
F38. Zr vs. K2O for Site 1204, Site 1203, Hawaiian lavas, and Sites 883 and 884.
F39. Vector plots: sediment above basement, Hole 1204A.
F40. Vector plots showing departures from ideal behavior.
F41. Paleomagnetic inclinations vs. depth.
F42. Poorly defined magnetic components, Hole 1204A basalt.
F43. Poorly defined magnetic components, Hole 1204B basalt.
F44. Magnetic susceptibility, Koenigsberger ratio, and MDF, Hole 1204A.
F45. Magnetic susceptibility, Koenigsberger ratio, and MDF, Hole 1204B.
F46. Examples of Lowrie-Fuller tests.
F47. IRM and backfield IRM.
F48. Incompletely demagnetized basalt, Hole 1204A.
F49. Incompletely demagnetized basalt, Hole 1204B.
F50. Orthogonal vector plots for Hole 1204A basalt.
F51. Orthogonal vector plots for Hole 1204B basalt.
F52. Orthogonal vector plots for Hole 1204B diabase.
F53. MDF for brown and green-gray basalt.
F54. GRA density, magnetic susceptibility, and NGR, Hole 1204A.
F55. GRA density, magnetic susceptibility, and NGR, Hole 1204B.
F56. NGR measurements.
F57. Thermal conductivity.
F58. Sedimentary unit index properties.
F59. Basement unit index properties.
F60. Compressional wave velocity.
F61. Site 1204 seismic reflection survey.
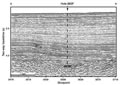
F62. Migrated time section of survey Line 1.
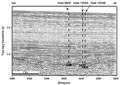
F63. Migrated time section of survey Line 3.
T1. Coring summary, Site 1204.
T2. Carbonate abundance data.
T3. Distribution, abundance, and biozones of nannofossils.
T4. Distribution, abundance, and biozones of nannofossils.
T5. Division, naming, and recovery of basement units.
T6. Lithologic components of basement units, Hole 1204B.
T7. ICP-AES whole-rock analysis for basalt.
T8. Petrographic summary of opaque minerals in basalt.
T9. Rock magnetic parameters for basalt samples.
T10. ChRM inclinations and summary statistics.
T11. MST magnetic susceptibility.
T12. GRA bulk density.
T13. Natural gamma ray measurements.
T14. Thermal conductivity.
T15. Index properties.
T16. Compressional wave velocity.
T17. SIOSEIS process parameters.