![]() Figures F1-F33
Figures F1-F33
![]() Tables
T1-T2
Tables
T1-T2
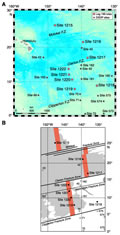
F1. Leg 199 and DSDP drill sites superimposed on bathymetry and Anomaly C25n.
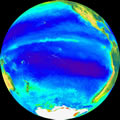
F2. Chlorophyll contents in the Pacific equatorial region.
F3. Position, thickness, and mass density of the equatorial sediment bulge in the equatorial Pacific Ocean.
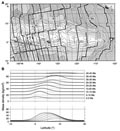
F4. Sites along the 56-Ma Leg 199 transect, superimposed on model estimates of upwelling.
F5. Compilation of benthic oxygen isotope data for the Cenozoic.
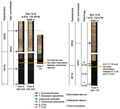
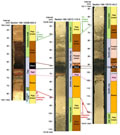
F6. Lithologic summary.
F7. LAS determined concentrations for smectite and illite vs. depth.
F8. Smectite-illite transition plotted as a function of age and latitude.
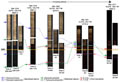
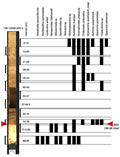
F9. Lithologic columns showing where diatoms are common to abundant, Sites 1218, 1219, 1220 and 1221.
F10. Late Eocene "pentachert" interval.
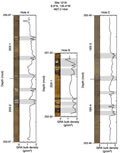
F11. Cores across the E/O boundary, Site 1218.
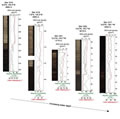
F12. Subsidence history of nonequatorial and equatorial sites, Sites 1215, 1217, and 1221.
F13. Relative position of the paleoequator for the middle Eocene and late Oligocene.
F14. Inferred paleolatitudes, Sites 1218, 1219, and 1220.
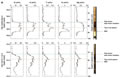
F15. Interstitial water profiles.
F16. Analyses of sedimentary Si and Ca weight percent and MARs.
F17. Summary of sedimentation rates derived from age-depth models.
![]()
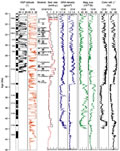
F18. Analyses of sedimentary Al and P weight percent and MARs.
F19. Si/Ti, Ba/Ti, and Al/Ti of Leg 199 sediments.
F20. Latitudinal transect of Si MARs for the early Oligocene, middle Eocene, and early Eocene.
F21. Latitudinal transect of Ca MARs for the early Oligocene, middle Eocene, and early Eocene.
F22. Synthesis of magnetic stratigraphy.
F23. Comparison of estimated ages of radiolarian zones.
F24. Digital photograph of the Oligocene-Miocene transition and Mi-1 glacial step, Site 1218.
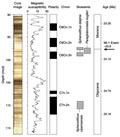
F25. MST, paleomagnetic, and biostratigraphic data, Sites 1218 and 1219.
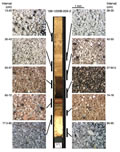
F26. Composite digital photographs showing the Eocene-Oligocene sequence and composite GRA bulk density, magnetic susceptibility, and color reflectance data.
F27. E/O boundary using biostratigraphic and magnetostratigraphic data.
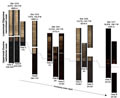
F28. Correlation and comparison of the E/O boundary sections.
F29. Comparison of diatom events to estimated position of equator crossings.
F30. P/E boundary sediments, Sites 1220 and 1221.
F31. Surface core scrape washed sample from across the P/E boundary.
F32. Stratigraphic distribution of benthic foraminifers.
F33. Analyses of sediment scrapes across the P/E boundary, Sites 1220 and 1221.
T1. Hole summary.
T2. Stratigraphic control around the E/O boundary.