![]() Figures
F1-F20
Figures
F1-F20
![]() Tables T1-T3
Tables T1-T3
F1. Map showing general locations of Legs 138, 112, and 201 sites.
F2. Lithostratigraphic summary, Leg 201 sites.
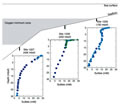
F3. Temperature profiles of Leg 201 sites.
F4. Cell enumeration data.
F5. Leg 201 cell counts compared to previously censused sites.
F6. Maximum DIC concentrations, Leg 201 sites.
F7. DIC profiles, Leg 201 sites.
F8. Sulfate and manganese, Leg 201 sites.
F9. Methane, Leg 201 sites.
F10. Methane, ethane, and propane, Site 1227.
F11. Nitrate, Sites 1225 and 1231.
F12. AODC and sulfate, barium, methane, and acetate, Site 1229.
F13. Iron and magnetic susceptibility, Site 1225.
F14. Manganese and NGR, Site 1226.
F15. Iron and magnetic susceptibility, Site 1229.
F16. Manganese, iron, and methane, Site 1229.
F17. Grain density, methane, and sulfate, Site 1227.
F18. Sulfate, Sites 1227, 1228, and 1229.
F19. Barium and sulfate, Site 1230.
F20. PFT and bead contamination tests.
T1. Operations summary.
T2. Summary of PCS operations.
T3. Summary of FPC operations.