![]() Figures F1-F37
Figures F1-F37
![]() Tables
T1-T15
Tables
T1-T15
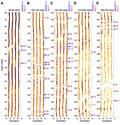
F1. Lithostratigraphic summary.
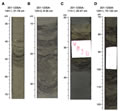
F2. Site 1230 features.
F3. Dissolved species in IW.
F4. Barium and sulfate profiles.
F5. Correlation of the top two cores in each hole.
F6. Downcore TOC profiles.
F7. Subsampling for MBIO, Hole 1230A.
F8. Subsampling for MBIO, Hole 1230B.
F9. Subsampling for MBIO, Hole 1230C.
![]()
F10. Prokaryotic cells enumerated.
F11. Total prokaryote profile.
F12. Prokaryotic cell numbers, 65-245 mbsf.
F13. IR scan of Core 201-1230A-26H.
F14. Core liner temperature profile, Hole 1230A.
F15. Core liner temperature profile, Holes 1230A and 1230B.
F16. MST volume magnetic susceptibility.
F17. Magnetic intensity and susceptibility.
F18. Principal component analysis, 201-1230A-17H-3, 89-91 cm.
F19. Principal component analysis, 201-1230A-19H-2, 10-12 cm.
F20. Principal component analysis, 201-1230A-22H-1, 60-62 cm.
F21. Density measurements.
F22. MAD measurements.
F23. P-wave velocity profiles.
F24. Natural gamma radiation.
F25. Thermal conductivity measurements.
F26. DVTP temperature records.
F27. Temperatures vs. depth.
F28. DVTP-P pressure.
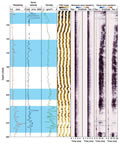
F29. Main logs recorded, Hole 1230A.
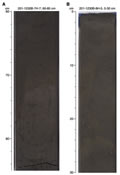
F30. FMS images.
F31. Hole 1230A temperature log.
F32. IR temperature comparisons.
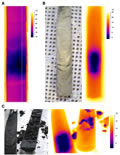
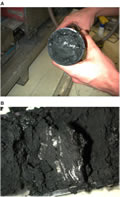
F33. Gas hydrate filling fractures.
F34. Methane expansion and gas hydrates.
F35. IW chloride concentrations.
F36. Logging data evidence of gas hydrates.
F37. Comparison of depths with gas hydrates.
T1. Coring summary, Site 1230.
T2. Dissolved species in IW.
T3. Sulfate analyses before and after storage.
T4. Hydrogen concentrations.
T5. Hydrocarbon gas concentrations.
T6. Gas analyses of vacutainer samples.
T7. Rock-Eval pyrolysis.
T8. Seawater contamination based on PFT.
T9. Potential contamination of slurries based on PFT.
T10. Potential contamination of slurries based on beads.
T11. Media inoculated with material from Site 1230.
T12. Downhole temperatures.
T13. Detail of logging operations, Hole 1230A.
T14. Observations and evidence of gas hydrate.
T15. Chemical species in gas hydrate.