![]() Figures F1-F20
Figures F1-F20
![]() Figures
F21-F35
Figures
F21-F35
![]() Tables
T1-T22
Tables
T1-T22
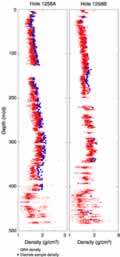
F21. MAD bulk density vs. GRA bulk density.
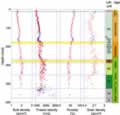
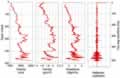
F22. Wet bulk density, VP, grain density, and porosity.
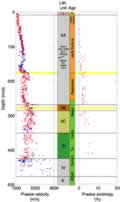
F23. VP measurements and P-wave anisotropy.
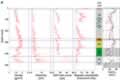
F24. MST data vs. lithostratigraphic units.
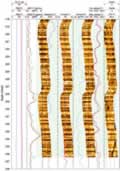
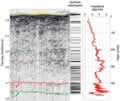
F25. High-resolution MGT gamma ray logs.
F26. Logging runs.

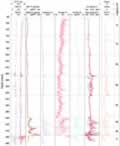
F27. Borehole caliper logs.
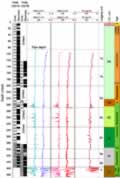
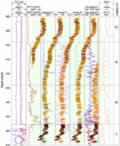
F28. Geophysical logs and equivalent core physical properties.
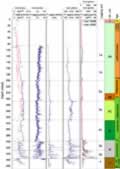
F29. Geophysical logs, caliper data, and logging units.
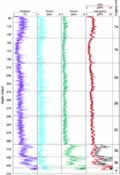
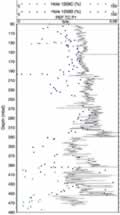
F30. Wireline physical property variations.
F31. Stratigraphy of the black shale interval.
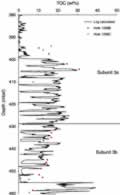
F32. Core-measured vs. log-calculated TOC.
F33. PEF and CaCO3 percentages.
F34. Density, velocity, impedance, and reflection profiles.
F35. Line GeoB221, synthetic seismogram, and impedance.
T1. Coring summary.
T2. Lithostratigraphic unit boundaries.
T3. Calcareous nannofossils.
T4. Planktonic foraminifers, Hole 1258A.
T5. Planktonic foraminifer datums.
T6. Core catcher ages.
T7. Planktonic foraminifers, Hole 1258B.
T8. Planktonic foraminifers, Hole 1258C.
T9. Shipboard cryogenic magnetometer analyses.
T10. Polarity interpretations and characteristic directions.
T11. Composite depth offsets.
T12. Splice tie points.
T13. Nannofossil and foraminifer datums.
T14. Magnetostratigraphic datums.
T15. LSRs and MARs.
T16. Carbon and nitrogen.
T17. Rock-Eval pyrolysis.
T18. Headspace analyses of interstitial and microbial gases.
T19. NGA analyses of interstitial and microbial gases.
T20. Interstitial water analyses.
T21. MAD from discrete samples.
T22. Velocity measurements.