![]() Figures F1-F20
Figures F1-F20
![]() Figures
F21-F35
Figures
F21-F35
![]() Tables
T1-T22
Tables
T1-T22
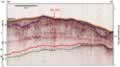
F1. Seismic line GeoB221.
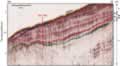
F2. Seismic line 207-L1S.
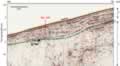
F3. Industry multichannel seismic reflection line.
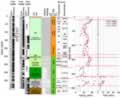
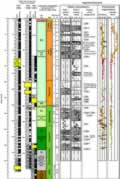
F4. Lithostratigraphic units, carbonate content, and TOC.
F5. Representative lithologies from Unit II.
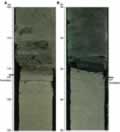
F6. Transition from calcareous nannofossil clay to black shale.
F7. Typical lithologies.
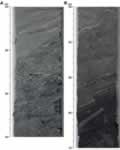
F8. Representative lithologies of black shale from Unit IV.
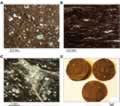
F9. Minor lithologies of black shale from Unit IV.
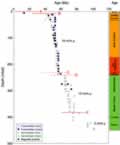
F10. Foraminifer, nannofossil, and radiolarian biozonation.
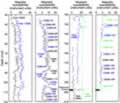
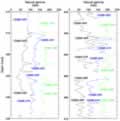
F11. Shipboard paleomagnetic data.
F12. Shore-based magnetostratigraphy.
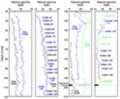
F13. Composite and spliced magnetic susceptibility.
F14. Composite and spliced NGR data.
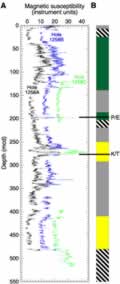
F15. Magnetic susceptibility data.
F16. NGR data.
F17. Age-depth plot.
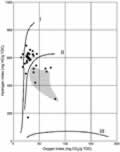
F18. Rock-Eval van Krevelen-type diagram.
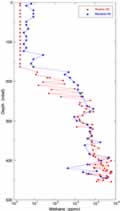
F19. Headspace gas and microbial methane concentrations.
F20. Interstitial water analyses.