![]() Figures F1-F20
Figures F1-F20
![]() Figures
F21-F33
Figures
F21-F33
![]() Tables
T1-T22
Tables
T1-T22
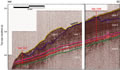
F1. Seismic lines GeoB219 and GeoB220.
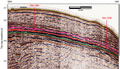
F2. Seismic reflection lines C2206a and GeoB219.
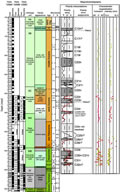
F3. Carbonate and TOC content.
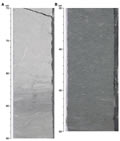
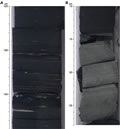
F4. Representative lithologies, Units I and II.
F5. Boundary between Units II and III.
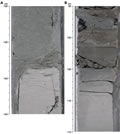
F6. K/T boundary ejecta layer.
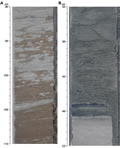
F7. Boundary between Units III and IV.
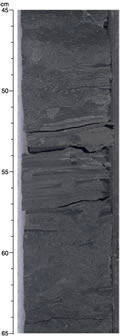
F8. Sedimentary structures in Subunit IIIB.
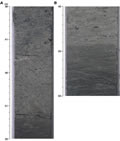
F9. Typical lithologies in Unit IV.
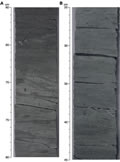
F10. Typical lithology and sedimentary structures, Unit V.
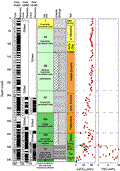
F11. Planktonic foraminifer, calcareous nannofossil, and radiolarian biozonation.
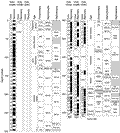
F12. Shipboard paleomagnetic data.
F13. Shore-based paleomagnetic data.
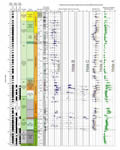
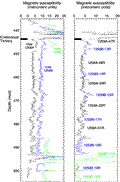
F14. Magnetic susceptibility data, lower Eocene.
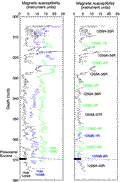
F15. Magnetic susceptibility data, Campanian–Maastrichtian.
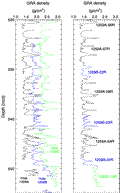
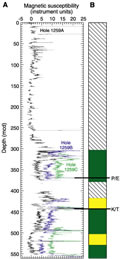
F16. GRA bulk density data.
F17. Magnetic susceptibility data vs. composite depth.
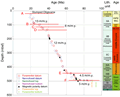
F18. Age-depth plot.
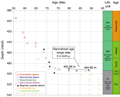
F19. Expanded age-depth plot.
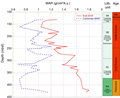
F20. MAR and carbonate MAR.
![]() Figures F1-F20
Figures F1-F20
![]() Figures F21-F33
Figures F21-F33
![]() Tables T1-T22
Tables T1-T22