![]() Figures F1-F20
Figures F1-F20
![]() Figures
F21-F33
Figures
F21-F33
![]() Tables
T1-T22
Tables
T1-T22
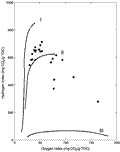
F21. Rock-Eval van Krevelen–type diagram.
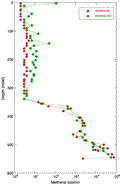
F22. Headspace gas and microbial methane concentrations.
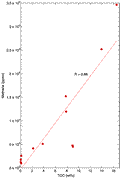
F23. TOC and methane concentrations.
F24. Pore water chemical constituents.
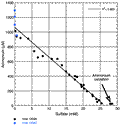
F25. Pore water sulfate vs. ammonium.
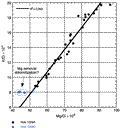
F26. Pore water Mg/Cl vs. K/Cl.
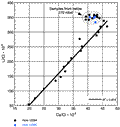
F27. Pore water Ca/Cl vs. Li/Cl.
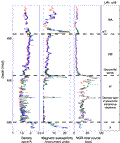
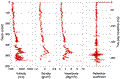
F28. Discrete physical property measurements.
F29. Acoustic velocity and velocity anisotropy.
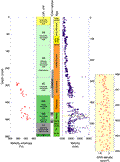
F30. MST data.
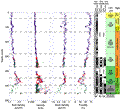
F31. MST data across the K/T boundary.
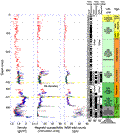
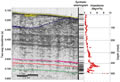
F32. Impedance and reflection coefficient profiles.
F33. Impedance contrasts.
T1. Coring summary.
T2. Summary of units and subunits.
T3. Calcareous nannofossils.
T4. Planktonic foraminifers, Hole 1259A.
T5. Planktonic foraminifer datums.
T6. Radiolarian datums.
T7. Datum levels, ages, and preservation of samples.
T8. Planktonic foraminifers, Hole 1259B.
T9. Planktonic foraminifers, Hole 1259C.
T10. Characteristic directions of minicores.
T11. Composite depth offsets.
T12. Splice tie points.
T13. Calcareous nannofossil and planktonic foraminiferal datums.
T14. Magnetostratigraphic datums.
T15. LSR and MAR.
T16. TOC, inorganic carbon, and total nitrogen.
T17. Rock-Eval pyrolysis analyses.
T18. Headspace analysis of gases.
T19. Pore water chemical analyses.
T20. MAD of discrete samples.
T21. GRA vs. MAD bulk density.
T22. P-wave velocity.
![]() Figures F1-F20
Figures F1-F20
![]() Figures F21-F33
Figures F21-F33
![]() Tables T1-T22
Tables T1-T22