![]() Figures F1-F20
Figures F1-F20
![]() Figures
F21-F40
Figures
F21-F40
![]() Figures
F41-F48
Figures
F41-F48
![]() Tables
T1-T18
Tables
T1-T18
F21. XRD diffractogram and image of a "proto-chert" nodule.
F22. Digital image, MS, and chromaticity of a clay layer.
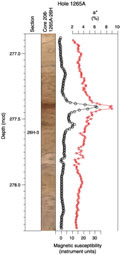
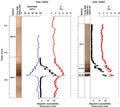
F23. Digital image, carbonate, MS, and chromaticity across the P/E boundary.
F24. Planktonic foraminiferal and calcareous nannofossil biozonation.
F25. Sedimentation rates.
F26. Effects of core scraping on magnetization.
F27. Intensities, 0- and 15-mT demagnetization.
F28. Initial MS.
F29. nDRM15 mT.
F30. Magnetostratigraphic interpretation.
F31. Chemical constituents in interstitial waters.
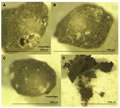
F32. Manganese oxide nodules.
F33. Sedimentary carbonate.
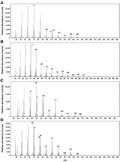
F34. Mass chromatogram for hexane eluate.
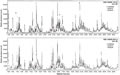
F35. Mass spectra of selected peaks in hexane eluate.
F36. Logging operations summary.
F37. Quality control of downhole logging runs.
F38. Depth shifting using NGR logs.
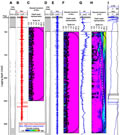
F39. Downhole log stratigraphy.
F40. Composite section to equivalent logging depth.
![]() Figures F1-F20
Figures F1-F20
![]() Figures
F21-F40
Figures
F21-F40
![]() Figures
F41-F48
Figures
F41-F48
![]() Tables
T1-T18
Tables
T1-T18