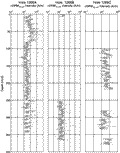
![]() Figures F1-F20
Figures F1-F20
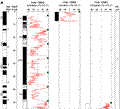
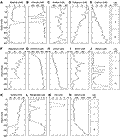
![]() Figure
F21-F31
Figure
F21-F31
![]() Tables
T1-T14
Tables
T1-T14
F21. Sedimentation rates.
F22. Inclination and intensity test data.
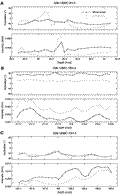
F23. Intensities, 0- and 15-mT demagnetization.
F24. Initial MS.
F25. nDRM15 mT.
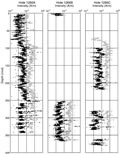
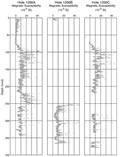
F26. Magnetostratigraphic interpretation.
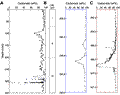
F27. Chemical constituents in interstitial waters.
F28. Sedimentary carbonate vs. composite depth.
F29. Mass chromatograms of aliphatic hydrocarbons.
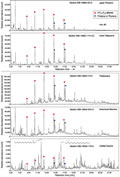
F30. Examples of mass chromatograms.
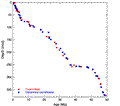
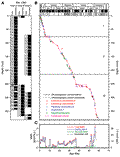
F31. Age-depth model.
T1. Coring summary.
T2. Composite depth scale.
T3. Splice tie points.
T4. Lithostratigraphic subdivisions.
T5. Selected calcareous nannofossil datums.
T6. Range and abundance of calcareous nannofossils.
T7. Selected planktonic foraminiferal datums.
T8. Range and abundance of planktonic foraminifers.
T9. Selected benthic foraminifers.
T10. Magnetostratigraphic age-depth tie points.
T11. Pore water analyses.
T12. Sedimentary calcium carbonate and total and organic carbon concentrations.
T13. Datum levels.
T14. Age-depth model, LSRs, and MARs.
![]() Figures F1-F20
Figures F1-F20
![]() Figure F21-F31
Figure F21-F31
![]() Tables T1-T14
Tables T1-T14