![]() Figures F1-F27
Figures F1-F27
![]() Figures
F28-F54
Figures
F28-F54
![]() Figures
F55-F80
Figures
F55-F80
![]() Tables
T1-T12
Tables
T1-T12
F55. Ni vs. Mg# and Cr vs. Al2O3.
F56. TiO2, Zr, V, and Sc vs. Al2O3.
F57. TiO2, K2O, Al2O3, CaO, Na2O, and FeO vs. MgO.
F58. H2O vs. K2O for mafic rocks.
F59. Cr vs. MgO for mafic rocks.
F60. Zr vs. MgO and Sr vs. Zr for mafic rocks.
F61. Physical properties.
F62. MST magnetic susceptibility and NGR.
F63. Thermal conductivity.
F64. Apparent thermal conductivity anisotropy.
F65. Mean thermal conductivity vs. bulk density.
F66. P-wave velocity vs. wet bulk density.
F67. Archive-half magnetic measurements.
F68. Demagnetization, Unit I.
F69. Demagnetization, Unit II.
F70. Inclinations and declinations.
F71. Projections of eigenvectors, Unit II.
F72. Geophysical logs.
F73. GPIT orientation and magnetic field logs.
F74. GPIT estimation of magnetic anomalies.
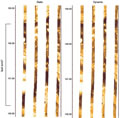
F75. FMS images of a potential faulted zone.
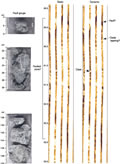
F76. Apparent fault and steep fractures in FMS images.
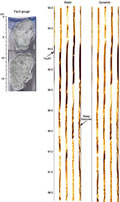
F77. Apparent fault zone in FMS images.
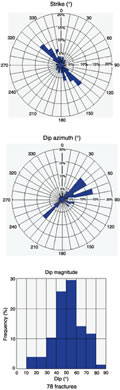
F78. Strike and dip azimuth and magnitude from FMS images.
F79. Fault gouge attitudes from core-log measurements.
F80. Resistivity and gamma ray correlation.
![]() Figures F1-F27
Figures F1-F27
![]() Figures
F28-F54
Figures
F28-F54
![]() Figures
F55-F80
Figures
F55-F80
![]() Tables
T1-T12
Tables
T1-T12