![]() F1-30
F1-30
![]() T1-8
T1-8
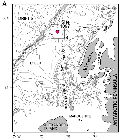
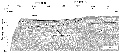
F1. Location of Site 1097 on single-channel seismic reflection profile PD88-04.
![]()
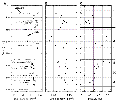
F2. Bathymetric map and seismic reflection profiles around Site 1097.
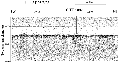
F3. 3.5-kHz sub-bottom profile across Site 1097.
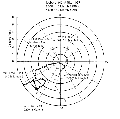
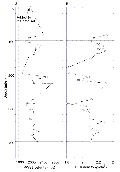
F4. Iceberg tracking at Site 1097.
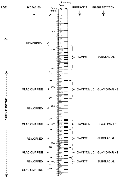
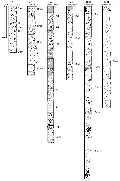
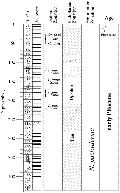
F5. Lithofacies, biofacies, age, and inferred environmental setting for Hole 1097A.
F6. Graphic log from representative cores for Hole 1097A.
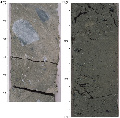
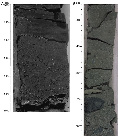
F7. Representative examples of massive diamict lithofacies from Site 1097.
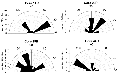
F8. Distribution of dip angles of elongate clasts, Hole 1097A.
F9. Downhole clast litho logy from Site 1097.
F10. Graded diamict facies at Hole 1097A.
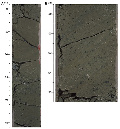
F11. Stratified diamict facies from Hole 1097A.
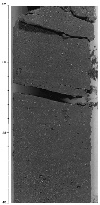
F12. Weakly laminated silty clay with ice-rafted clasts, interval 178-1097A-34R-1, 26-40 cm.
F13. Summary of facies recovered at Site 1097.
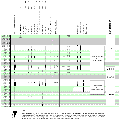
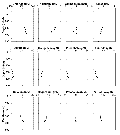
F14. The occurrence of diatoms, radiolarians, and planktonic foraminifers at Site 1097.
F15. Diatom stratigraphy at Site 1097.
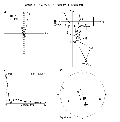
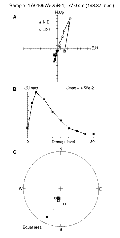
F16. Inclination of the magnetization vector.
F17. Orthogonal projection of the end-points of the remanence vector for Sample 178-1097A-15R-1, 53 cm.
F18. Orthogonal projection of the end-points of the remanence vector for Sample 178-1097A-27R-1, 34 cm.
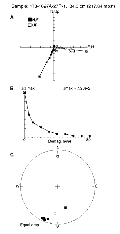
F19. Orthogonal projection of the end-points of the remanence vector for Sample 178-1097A-25R-1, 77 cm.
F20. Calcium carbonate concentrations for Hole 1097A.

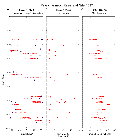
F21. Profiles of interstitial water chemistry from Hole 1097A.
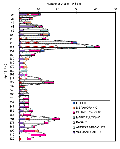
F22. Ratios between X-ray diffraction intensities of selected peaks for chlorite, illite, and mixed-layer clays.
![]()
F23. Raw data for NGR, GRAPE density, and magnetic susceptibility.
F24. Index properties plots: MAD and GRAPE bulk density, grain density, and porosity.
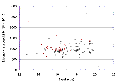
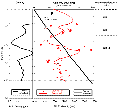
F25. Magnetic susceptibility vs. natural gamma emission rates of sediments from subglacial intervals.
F26. Comparison of PWS3 velocity and MAD bulk density.
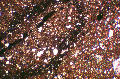
F27. Photomicrograph of Sample 178-1097A-25R-1, 91 cm.
F28. MCS profile AISM-06 across Site 1097.
F29. Detail of MCS profile AISM-06 across Site 1097.
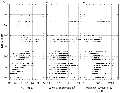
F30. Traveltime-depth function and correlation between physical properties and seismic units.
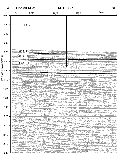
T1. Site 1097 coring summary.
T2. Benthic foraminiferal biofacies of shipboard samples from Site 1097.
T3. Volatile hydrocarbons measured at Site 1097.
T4. Summary of inorganic carbon, carbonate, and elemental analyses for Hole 1097A.
T5. Results of interstitial water analyses for Hole 1097A.
T6. Relative intensities of selected X-ray diffraction peaks from bulk mineral samples of Site 1097 sediments.
T7. Relative intensities of selected X-ray diffraction peaks from clay mineral samples of Site 1097 sediments.
T8. Trace-element chemistry of bulk sediment in Hole 1097A.