![]() Figures F1-F34
Figures F1-F34
![]() Tables
T1-T19
Tables
T1-T19
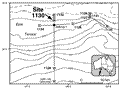
F1. Map showing Site 1130 in relation to other Leg 182 sites and the AGSO160 seismic lines.
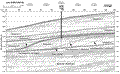
F2. Portion of seismic line AGSO169/13a showing seismic stratigraphic sequences at Site 1130.
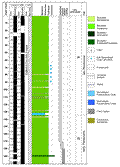
F3. Site 1130 sediment lithostratigraphy.
F4. Turbidite from the lower part of Subunit IB.

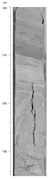
F5. Slump marking the boundary between lithostratigraphic Units I and II.
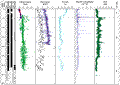
F6. Calcareous nannofossil and planktonic foraminifer zones and benthic foraminifer assemblages.

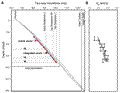
F7. Sedimentation rate curve from datum levels for Site 1130.

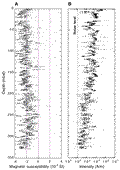
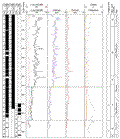
F8. Paleomagnetic intensity of magnetization and magnetic susceptibility downhole, Hole 1130A.
F9. Demagnetization analysis for Sample 1130A-9H-5, 51-53 cm.
![]()
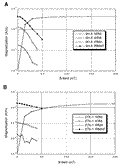
F10. Plots of demagnetization of NRM, ARM, and IRMs and of the acquisition of IRM for samples from Hole 1130A.
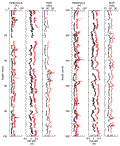
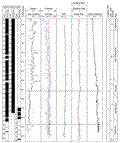
F11. Magnetostratigraphy of Holes 1130A and 1130B.

F12. Composite depth section produced using Splicer software.
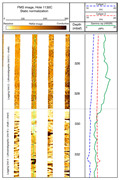
F13. Spliced section of smoothed color reflectance data produced using Splicer software.

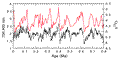
F14.
Spliced and tuned color reflectance record compared to the Site 656 composite
seawater ![]() 18O
curve.
18O
curve.
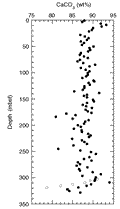
F15. Calcium carbonate content in samples from Site 1130.
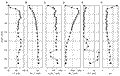
F16. Concentration depth profiles of salinity, Cl-, K+, Ca2+, Mg2+, and Sr2+.

F17. Concentration depth profiles of Li+, SO42-, H4SiO4, NH4+, Fe2+, and pH.
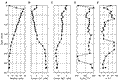
F18. Concentration depth profiles of alkalinity, Ca2+, Mg2+, silica, lithium.
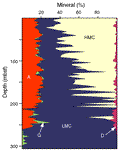
F19. Variations in mineral concentrations.
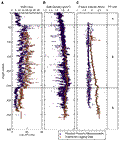
F20. Discrete P-wave velocities, bulk densities, porosity, magnetic susceptibility, and NGR measurements.
F21. Downhole logging data and physical properties measurements.
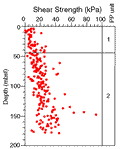
F22. Shear strength measurements.
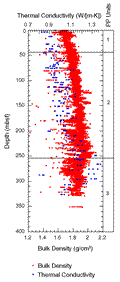
F23. Thermal conductivity measurements.
F24. Variation of in situ formation temperature with depth.

F25. Spectral gamma-ray logs from HNGS vs. depth,.
F26. Comparison between geophysical logs and physical properties measured on the recovered cores.
F27. Spectral gamma-ray logs from the HNGS vs. depth.

F28. Geophysical logs vs. depth from triple combo and FMS/sonic string.

F29. FMS image of boundary between logging Units 2 and 3, and boundary between lithostratigraphic Units II and III.
F30. Seismic site-survey tracks for Site 1130 in relation to other Leg 182 sites and the AGSO169 site-survey seismic lines.
F31. Portion of seismic Line AGSO169/13a.
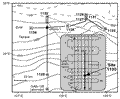
F32. Check-shot stations and acquisition geometry for the WST survey.

F33. Predicted and corrected depths and interval velocities.
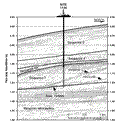
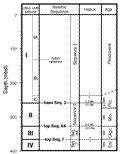
F34. Lithostratigraphic units, seismic sequences, biostratigraphic hiatuses, and ages
T1. Site 1130 coring summary.
T2. Datum levels used in the graph of sedimentation rate.
T3. Site 1130 core and section depths in mcd and mbsf.
T4. Site 1130 biostratigraphic data used for correlations.
T5. Site 1130 splice tie points.
T6. Headspace gases.
T7. Calcium carbonate content.
T8. Interstitial water geochemistry.
T9. XRD data.
T10. P-wave velocity measurements.
T11. GRA densiometry measurements.
T12. Magnetic susceptibility measurements.
T13. Natural gamma-ray measurements.
T14. Thermal conductivity measurements.
T15. Discrete P-wave velocity measurements.
T16. Index properties measurements.
T17. Undrained shear strength measurements.
T18. Tool strings, intervals logged, and logging speeds for Hole 1130C.
T19. Differences between depths to key horizons and corrected depths.