![]() Figures F1-F10
Figures F1-F10
![]() Figures
F11-20
Figures
F11-20
![]() Figures
F21-F30
Figures
F21-F30
![]() Figures
F31-F40
Figures
F31-F40
![]() Figures
F41-F50
Figures
F41-F50
![]() Figures
F51-F60
Figures
F51-F60
![]() Figures
F61-F70
Figures
F61-F70
![]() Figures
F71-F80
Figures
F71-F80
![]() Figures
F81-F90
Figures
F81-F90
![]() Figures
F91-F96
Figures
F91-F96
![]() Tables
T1-T21
Tables
T1-T21
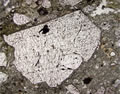
F51. Photomicrograph of fractured sanidine phenocryst from Unit 9 tuff.
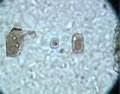
F52. Photomicrograph of melt inclusions in sanidine crystals from Unit 9.
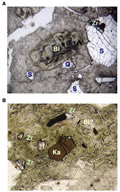
F53. Photomicrographs highlighting the breakdown of mafic crystals in the Unit 9 tuff.
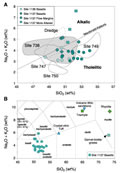
F54. Total alkali vs. SiO2 abundance.
F55. Covariation diagrams comparing basalts from Site 1137 with those from other parts of the Kerguelen Plateau.
F56. Trace element contents of basalts.
F57. Variations of major and trace element abundances with depth in Hole 1137A.
F58. Incompatible trace element compositions of basalts.
F59. Primitive mantle-normalized incompatible element contents of basalts.
F60. Primitive mantle-normalized Nb/Ce, Zr/Ti, and Nb/Zr vs. Zr/Y ratio or Zr content.
![]() Figures F1-F10
Figures F1-F10
![]() Figures
F11-20
Figures
F11-20
![]() Figures
F21-F30
Figures
F21-F30
![]() Figures
F31-F40
Figures
F31-F40
![]() Figures
F41-F50
Figures
F41-F50
![]() Figures
F51-F60
Figures
F51-F60
![]() Figures
F61-F70
Figures
F61-F70
![]() Figures
F71-F80
Figures
F71-F80
![]() Figures
F81-F90
Figures
F81-F90
![]() Figures
F91-F96
Figures
F91-F96
![]() Tables
T1-T21
Tables
T1-T21