![]() Figures F1-F10
Figures F1-F10
![]() Figures
F11-20
Figures
F11-20
![]() Figures
F21-F30
Figures
F21-F30
![]() Figures
F31-F40
Figures
F31-F40
![]() Figures
F41-F50
Figures
F41-F50
![]() Figures
F51-F60
Figures
F51-F60
![]() Figures
F61-F70
Figures
F61-F70
![]() Figures
F71-F80
Figures
F71-F80
![]() Figures
F81-F90
Figures
F81-F90
![]() Figures
F91-F96
Figures
F91-F96
![]() Tables
T1-T21
Tables
T1-T21
F91. Comparison of logging data and core-derived lithology.
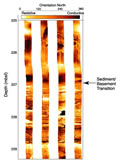
F92. FMS image displaying the sediment-igneous basement transition.
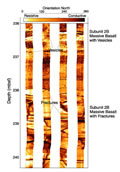
F93. FMS image displaying basement Unit 2.
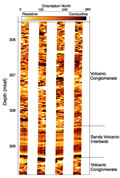
F94. FMS image displaying basement Unit 6.
F95. Scatter plots of bulk density vs. P-wave velocity, S-wave velocity, and porosity, and resistivity vs. porosity.
F96. Caliper log showing changes in hole diameter measured along caliper 1 and 2 and the azimuth of caliper 1.
T1. Coring summary.
T2. Expanded coring summary.
T3. Summary of lithologic units.
T4. XRD results and carbonate contents.
T5. Summary of thin sections.
T6. Summary of volcaniclastic components.
T7. Curated positions and depths of basement units.
T8. Curated downhole depths of key horizons in the lava flows.
T9. Flow thicknesses and recovery.
T10. Petrographic and unit summary of igneous basement sampled.
T11. Major and trace element data for basalt samples.
T12. Major and trace element data for felsic samples.
T13. Alteration minerals within basement units.
T14. Summary of NRM intensity and susceptibility.
T15. Characteristic inclinations and NRM intensities of discrete basalt.
T16. Index properties data.
T17. Compressional wave velocity of discrete samples.
T18. Thermal conductivity values.
T19. Carbon, nitrogen, sulfur, and hydrogen analyses of sediment.
T20. Carbon, nitrogen, sulfur, and hydrogen analyses of basalts.
T21. Summary of logging operations.
![]() Figures F1-F10
Figures F1-F10
![]() Figures
F11-20
Figures
F11-20
![]() Figures
F21-F30
Figures
F21-F30
![]() Figures
F31-F40
Figures
F31-F40
![]() Figures
F41-F50
Figures
F41-F50
![]() Figures
F51-F60
Figures
F51-F60
![]() Figures
F61-F70
Figures
F61-F70
![]() Figures
F71-F80
Figures
F71-F80
![]() Figures
F81-F90
Figures
F81-F90
![]() Figures
F91-F96
Figures
F91-F96
![]() Tables
T1-T21
Tables
T1-T21