![]() Figures F1-F59
Figures F1-F59
![]() Figures F60-F77
Figures F60-F77
![]() Tables T1-T23
Tables T1-T23
F60. profiles of K2O/Al2O3, Na2O/Al2O3, and MgO/Al2O3.
F61. Profiles of "terrigenous clay and ash," Al/Ti, and Nb/Al.
F62. Profile of dispersed ash.
F63. Inclinations of natural remanent magnetization.
F64. Alternating field demagnetization.
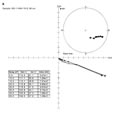
F65. Magnetostratigraphy after demagnetization at 25 mT.
F66. Inclinations of Unit I compared to the late Cenozoic magnetic polarity time scale.
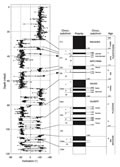
F67. Sedimentation rate curve for Site 1149.
F68. Index properties, thermal conductivity, and shear strength.
F69. Crossplots of physical properties.

F70. MST measurement on whole cores.
F71. Compressional wave velocity on split cores and discrete cube samples.
F72. Radioactive element logging measurements.
F73. Geophysical logging measurements.
F74. Geochemical logging measurements.
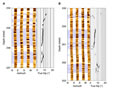
F75. Dipmeter analysis and FMS images.
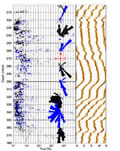
F76. FMS images and dip analysis.
F77. Sediment PFT results.
T1. Coring summary.
T2. Expanded coring summary.
T3. Lithologic units.
T4. Carbonate content of sediments, Hole 1149B.
T5. Igneous core descriptions.
T6. Location of volcanic glass.
T7. Primary mineralogy of thin sections.
T8. XRF and ICP-AES and -MS analyses.
T9. Vein types, Holes 1149B and 1149C.
T10. Vein types, Hole 1149D.
T11. Interstitial water data.
T12. Concentrations of CH4.
T13. XRF sample lithologies.
T14. Geochemical data for carbonate-poor sediments.
T15. Geochemical data for carbonate-rich sediments.
T16. Physical properties of discrete samples.
T17. Average values of physical properties.
T18. Compressional wave velocities.
T19. Thermal conductivity values.
T20. Shear strength.
T21. List of microbiological samples.
T22. Results of PFT tests.
T23. Results of fluorescent microsphere tests on sediment samples.