![]() Figures F1-F29
Figures F1-F29
![]() Tables
T1-T13
Tables
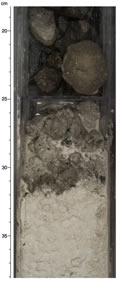
T1-T13
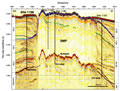
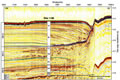
F1. Seismic line MAR07.
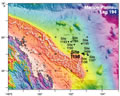
F2. Bathymetry map.
F3. Lithologic summary.
F4. Close-up photograph of synsedimentary soft sediment deformation.
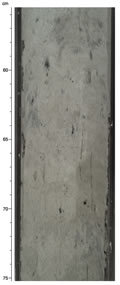
F5. Close-up photograph of boundary between periplatform sediment and a layer of phosphatic nodules.
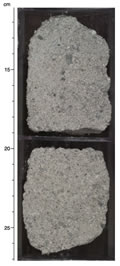
F6. Close-up photograph of coarse-grained periplatform sediment facies.
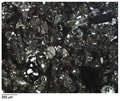
F7. Photomicrograph of fine-grained periplatform sediment facies.
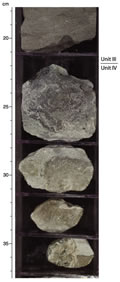
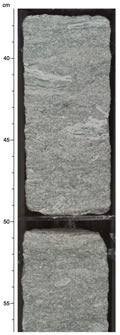
F8. Close-up photograph of Unit III/IV boundary.
F9. Photomicrograph of thin section close-up of laminae of pyrite and phosphate.
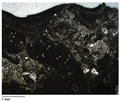
F10. Close-up photograph of deep euphotic shelf facies.
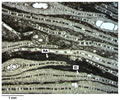
F11. Photomicrograph showing foraminiferal boundstone with thin larger benthic foraminifers bound together by thin red algal crusts.
F12. Long-core measurements, Hole 1198A.
F13. Long-core measurements, Hole 1198B.
F14. Remanent magnetism characteristics.
F15. Downcore variation of intensity of NRM, ARM, and IRM.
F16. Age-depth model and sedimentation rates.
F17. Dissolved constituents.
F18. Dissolved sodium.
F19. Carbonate and noncarbonate fractions.
F20. Carbon, HI, and sulfur plots.
F21. Bulk density, grain density, and porosity.
F22. Compressional wave velocity and anisotropy.
F23. Velocity-porosity crossplot.
F24. Thermal conductivity.
F25. Thermal conductivity as a function of porosity.
F26. Magnetic susceptibility, natural gamma radiation, and lightness.
F27. Summary of logging results.
F28. Comparison of downhole and core logging data.
F29. Multichannel seismic line MAR07.
T1. Coring summary.
T2. Expanded coring summary.
T3. Lithologic units and subunits.
T4. Biostratigraphic datums.
T5. Summary of paleoenvironmental interpretations.
T6. Age-depth control points.
T7. Age picks.
T8. Headspace gas composition.
T9. Interstitial water chemistry.
T10. Aragonite, calcite, dolomite, and noncarbonate mineral percentages.
T11. Carbon, nitrogen, sulfur, and hydrogen results.
T12. Rock-Eval pyrolysis results.
T13. Logging operations, Hole 1198B.