![]() Figures F1-F41
Figures F1-F41
![]() Tables
T1-T19
Tables
T1-T19
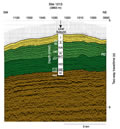
F1. Interpretation of seismic reflection across Site 1213.
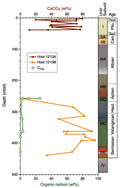
F2. Core recovery, lithology, lithologic units, age with corresponding biostratigraphic zonations, and percent carbonate.
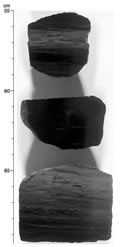
F3. Composite digital photograph and color reflectance red/blue (680/420 nm) ratio, Core 198-1213A-6R and Section 7R-1.
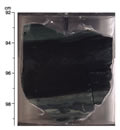
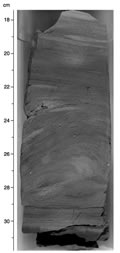
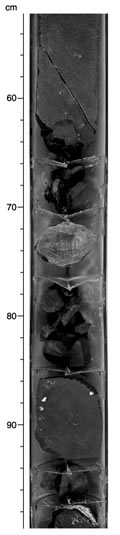
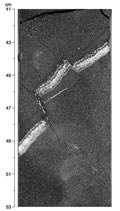
F4. Digital photograph showing the early OAE1a equivalent and associated sediment.
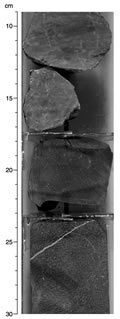
F5. Pieces of early Aptian relatively Corg-rich radiolarian claystone of Subunit IIIC.
F6. Homogeneous, black radiolarian claystone of early Aptian age.
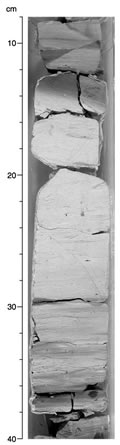
F7. Bioturbated Berriasian chalk-nannofossil claystone cycle in Subunit IIID.
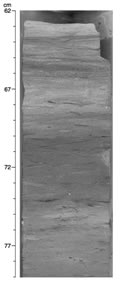
F8. Highly bioturbated fabric of Berriasian radiolarian chalks and clayey chalks of Subunit IIID.
F9. Soft-sediment deformation, probably a small slump unit, in clayey chalks of Subunit IIID.
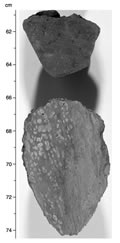
F10. X-ray diffractogram for hydrothermal alteration breccia.
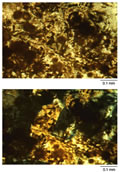
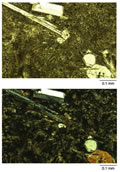
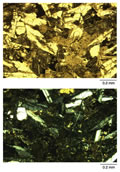
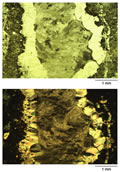
F11. Photomicrographs showing possible microbial structures enclosed in quartz crystal cement.
F12. Diabase units and numbered core pieces.
F13. Chilled margin above diabase and overlain by "baked" chert.
F14. Basalt recovered near metamorphosed sedimentary rock with burrow structures.
F15. Symmetrical basalt contact zones around a fragment of metachert.
F16. Basalt exhibiting sparsely phyric texture.
F17. Diabase showing intersertal to subophitic texture.
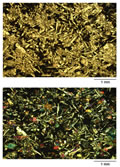
F18. Diabase showing subophytic texture with light plagioclase crystals.
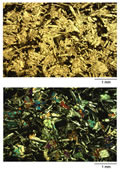
F19. Striped areas thought to be pyroxene (olivine?) crystals replaced by clay minerals.
F20. Large glomeroporphyritic cluster of plagioclase crystals.
F21. Diabase cut by a zoned calcite- and smectite-filled vein, offset by several thin filled veins.
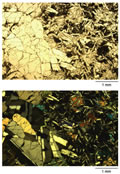
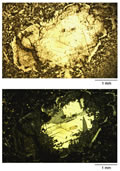
F22. Complex veins showing an early phase of botryoidal to bladed carbonate.
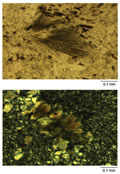
F23. Radiating fibrous crystals encased in microcrystalline quartz.
F24. Large plagioclase phenocryst that is complexly zoned.
F25. Estimated paleodepth.
F26. Plot of magnetic inclination vs. depth for the igneous section, Hole 1213B.
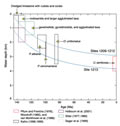
F27. Age-depth plot of calcareous nannofossil and planktonic foraminiferal datums.
F28. Age-depth plot of Neogene calcareous nannofossil and planktonic foraminiferal datums.
F29. Age-depth plot of Late Cretaceous-latest Jurassic calcareous nannofossil and planktonic foraminiferal datums.
F30. Carbonate profile.
F31. Oxygen and hydrogen indices.
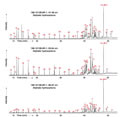
F32. GC-MS traces of aliphatic hydrocarbons.
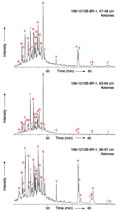
F33. GC-MS traces of ketone fractions.
F34. Whole-core MST magnetic susceptibility.
F35. Whole-core MST GRA bulk density.
F36. MST natural gamma radiation.
F37. Discrete P-wave velocities.
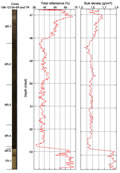
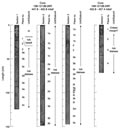
F38. Geophysical logs and equivalent core physical properties measurements, Hole 1213B.
F39. Geochemical logs, Hole 1213B.
F40. Gamma radiation and resistivity logs, Aptian sediments, Holes 1213B and 1207B.
F41. Detail of gamma radiation, density, and porosity logs around OAE1a black shale interval.
T1. Coring summary.
T2. Mineralogy and texture of diabase and basalt estimated from thin section.
T3. Mineralogy and lithology of metamorphosed sediment.
T4. Downhole variation in colors of recovered chert.
T5. Calcareous nannofossil datums, ages, and depths.
T6. Planktonic foraminifer datums, ages, and depths.
T7. Cenozoic and Cretaceous benthic foraminifers, Hole 1213A.
T8. Cretaceous benthic foraminifers, Hole 1213B.
T9. Headspace CH4 concentrations.
T10. Carbonate content.
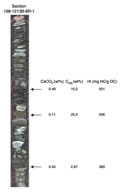
T11. CNSH analysis of samples from OAE1a.
T12. Organic carbon and Rock-Eval pyrolysis.
T13. Biomarkers and compound ratios.
T14. Biomarker carbon number ranges and relative abundances.
T15. Identities of hydrocarbon components.
T16. Identities of ketone components.
T17. Data collected at Site 1213.
T18. Discrete measurements of P-wave velocity.
T19. Minimum, maximum, and average P-wave velocities.