![]() Figures F1-F23
Figures F1-F23
![]() Tables
T1-T16
Tables
T1-T16
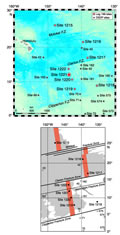
F1. Site location map.
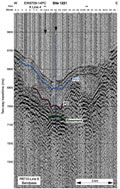
F2. Seismic reflection profile.
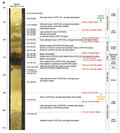
F3. Lithologic summary.
F4. P/E boundary intervals.
F5. Calcareous and siliceous biostratigraphy.
F6. Comparison of estimated zonal boundary ages.
F7. Magnetization intensities after AF demagnetization.
F8. Composite magnetic stratigraphy.
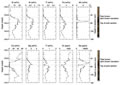
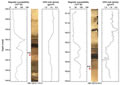
F9. GRA bulk density, magnetic susceptibility, and color reflectance data for the upper 20 mcd plotted vs. composite depth.
F10. LSRs and chronostratigraphic markers.
F11. Density record of site survey piston Core EW9709-14P compared to density record of Site 1221.
F12. MAR of sediments.
F13. Interstitial water data.
F14. Bulk-sediment data.
F15. CaCO3 data.
F16. Bulk-sediment geochemical data for the P/E boundary.
F17. MAD measurements.
F18. Magnetic susceptibility and GRA bulk density and the P/E boundary.
F19. Wet and dry bulk density plotted with GRA density.
F20. LAS mineralogy determinations.
F21. Compressional wave velocity.
F22. Natural gamma radiation.
F23. Magnetic susceptibility.
T1. Coring summary.
T2. Calcareous nannofossil datum events.
T3. Radiolarian zonal boundaries.
T4. Core disturbance intervals.
T5. Core composite depth offsets.
T6. Splice tie points.
T7. Paleomagnetic horizons.
T8. Nannofossil, foraminifer, and radiolarian datums.
T9. Depths, ages, rates, and fluxes of sediments.
T10. Interstitial water data.
T11. Bulk-sediment data.
T12. CaCO3 and Corg data.
T13. Moisture and density measurements.
T14. LAS-based mineralogy.
T15. Split-core velocity measurements.
T16. Thermal conductivity.