![]() Figures F1-F34
Figures F1-F34
![]() Tables
T1-T9
Tables
T1-T9
F1. Lithostratigraphic summary.
F2. Examples of XRD analyses.
F3. Bioturbation and magnetic susceptibility.
F4. Site 1225 features.
F5. Dissolved species in IW.
F6. Methane concentration.
F7. Calcium carbonate and organic carbon.
F8. Subsampling for MBIO sections, Hole 1225A.
F9. Subsampling for MBIO sections, Hole 1225C.
![]()
F10. Prokaryotic cells enumerated by AODC, at Site 1225.
F11. Total prokaryote profile.
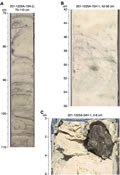
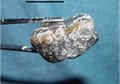
F12. Basalt from an XCB core catcher.
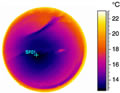
F13. Temperature trends measured with the IR camera.
F14. Comparison Holes 1225A and 1225C.
F15. Bottom end of a core immediately after section splits.
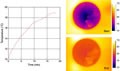
F16. Temperature increase of an exposed section end.
F17. Magnetic susceptibility data, Sites 1225 and 851.
F18. Declination and inclination profiles.
F19. Magnetic intensity at Site 1225.
F20. Principal component analysis, 201-1225C-1H-2, 93.5-95.5 cm.
F21. Principal component analysis, 201-1225C-1H-3, 109-111 cm.
F22. Principal component analysis, 201-1225C-5H-1, 138-140 cm.
F23. Principal component analysis, 201-1225C-12H-5, 69-71 cm.
F24. GRA density, Sites 1225 and Site 851B.
F25. GRA density overlain on MAD measurements.
F26. GRA and grain density and porosity.
F27. MST and PWS velocity profiles.
F28. Comparison of NGR measurements.
F29. Thermal conductivity and projected temperature profiles.
F30. Formation factor and conductive anisotropy profiles.
F31. Temperature vs. depth.
F32. Main logs recorded in Hole 1225A.
F33. Log comparison between Holes 1225A and 851B.
F34. Hole 1225A temperature log.
T1. Coring summary, Site 1225.
T2. Dissolved species in IW.
T3. Methane in headspace.
T4. Calculated interstitial water H2.
T5. Calcium carbonate and organic carbon.
T6. Potential contamination of slurries.
T7. Media inoculated with material from Site 1225.
T8. Downhole temperature measurements.
T9. Detail of logging operations.