![]() Figures F1-F33
Figures F1-F33
![]() Figures
F34-F65
Figures
F34-F65
![]() Figures
F66-F97
Figures
F66-F97
![]() Tables
T1-T15
Tables
T1-T15
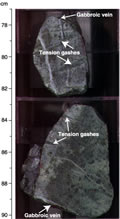
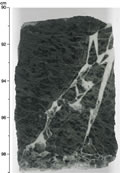
F66. Gabbroic vein with serpentine-filled tension gashes.
F67. Downhole metamorphic and magmatic vein intensity.
F68. Variation in vein intensity with depth.
F69. Dips of alteration veins.
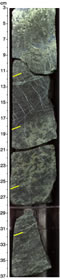
F70. Harzburgite cut by late lizardite veins.
F71. Dunite banding and modal pyroxene in harzburgites.
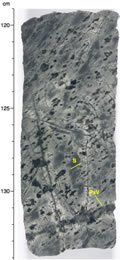
F72. Porphyroclastic texture in harzburgite.
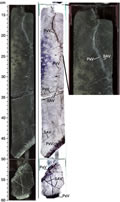
F73. Pyroxenite veins cutting deformed harzburgites.
F74. Downhole distribution/dip of magmatic veins and contacts.
F75. Poles to planes for foliation, veins, contacts, and gabbro fabrics.
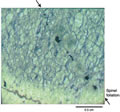
F76. Spinel foliation.
F77. Poles to crystal-plastic foliation.
F78. Poles to cataclastic shear zones and small faults.
F79. Poles to planes for alteration vein orientations.
F80. Fe2O3 MgO, and H2O vs. SiO2 in peridotites.
F81. FeO vs. MgO whole-rock concentrations of peridotites.
F82. Zr, Sc, and V vs. Al2O3 in peridotites.
F83. Cr, MgO, and LOI vs. SiO2 in gabbroic rocks.
F84. Fe2O3 and H2O rocks vs. magnetic susceptibility.
F85. Physical properties of peridotites and gabbros.
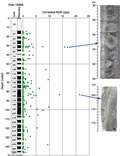
F86. NGR.
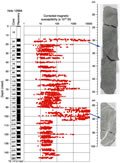
F87. MST magnetic susceptibility.
F88. Peridotite MST magnetic susceptibility.
F89. Thermal conductivity.
F90. Wet bulk density vs. P-wave velocity.
F91. P-wave velocity in gabbros and peridotites.
F92. Long-core magnetic measurements.
F93. Demagnetization of discrete samples.
F94. MDF and NRM unblocking temperatures.
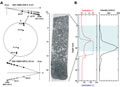
F95. Apparent reversal transition due to remanent intensity.
F96. PFT standard and samples.
F97. WSTP temperature results.
![]() Figures F1-F33
Figures F1-F33
![]() Figures
F34-F65
Figures
F34-F65
![]() Figures
F66-F97
Figures
F66-F97
![]() Tables
T1-T15
Tables
T1-T15