![]() Figures F1-F20
Figures F1-F20
![]() Figures F21-F40
Figures F21-F40
![]() Figures F41-F60
Figures F41-F60
![]() Figures F61-F80
Figures F61-F80
![]() Figures F81-F100
Figures F81-F100
![]() Figures F101-F120
Figures F101-F120
![]() Figures F121-F140
Figures F121-F140
![]() Figures F141-F160
Figures F141-F160
![]() Figures F161-F176
Figures F161-F176
![]() Tables T1-T20
Tables T1-T20
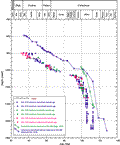
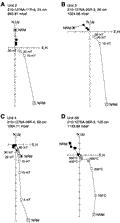
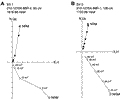
F141. Age-depth plots, Sites 1276 and 398.
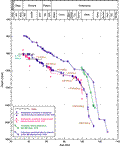
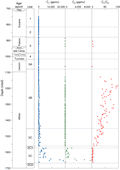
F142. Age-depth plots and zonal boundary ages.
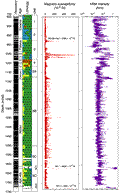
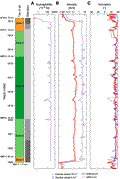
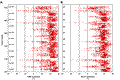
F143. Magnetic susceptibility and NRM intensity.
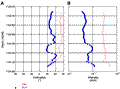
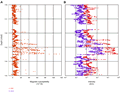
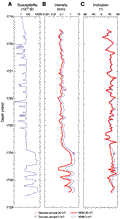
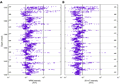
F144. Inclination and intensity.
F145. Zijderveld diagrams.
F146. Magnetic susceptibility and intensity before and after 30-mT AF demagnetization.
F147. Magnetic susceptibility, intensity, and inclination in the upper diabase sill.
F148. Magnetic susceptibility, intensity, and inclination in the lower diabase sill.
F149. Zijderveld diagrams for diabase sills.
F150. Core magnetization intensity for magnetic vs. nonmagnetic core barrels.
F151. Core magnetic inclination for magnetic vs. nonmagnetic core barrels.
F152. C1 and C2 concentrations and C1/C2 ratios.
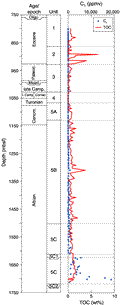
F153. C1 and TOC.
F154. CaCO3, TOC contents, and C/N ratios.
F155. TOC, Al, and Ba/Al, Ni/Al, Cr/Al, and V/Al.
F156. TOC contents and Rock-Eval pyrolysis results.
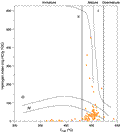
F157. Comparison of HI and Tmax.
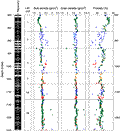
F158. GRA and MAD bulk density.
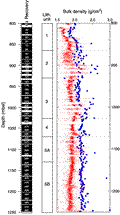
F159. Bulk density, grain density, and porosity.
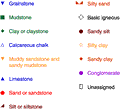
F160. Lithologic symbols.
![]() Figures F1-F20
Figures F1-F20
![]() Figures F21-F40
Figures F21-F40
![]() Figures F41-F60
Figures F41-F60
![]() Figures F61-F80
Figures F61-F80
![]() Figures F81-F100
Figures F81-F100
![]() Figures F101-F120
Figures F101-F120
![]() Figures F121-F140
Figures F121-F140
![]() Figures F141-F160
Figures F141-F160
![]() Figures F161-F176
Figures F161-F176
![]() Tables T1-T20
Tables T1-T20