![]() Figures F1-F20
Figures F1-F20
![]() Figures F21-F40
Figures F21-F40
![]() Figures F41-F60
Figures F41-F60
![]() Figures F61-F80
Figures F61-F80
![]() Figures F81-F100
Figures F81-F100
![]() Figures F101-F120
Figures F101-F120
![]() Figures F121-F140
Figures F121-F140
![]() Figures F141-F160
Figures F141-F160
![]() Figures F161-F176
Figures F161-F176
![]() Tables T1-T20
Tables T1-T20
F161. MAD porosity vs. depth.
F162. P-wave sensor 3 velocity.
F163. Velocity anisotropy.
F164. Thermal conductivity.
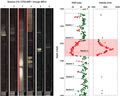
F165. NGR and magnetic susceptibility.
F166. Smoothed NGR and magnetic susceptibility.

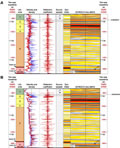
F167. Digital core images, NGR, and x-direction velocity.
F168. Digital core images and magnetic susceptibilities.
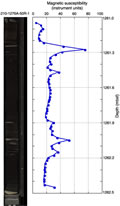
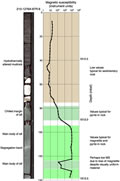
F169. Digital core image and MST magnetic susceptibility.
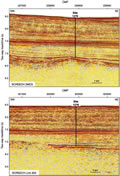
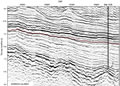
F170. Seismic reflection profiles of SCREECH lines 2MCS and 303.
F171. Horizontal and vertical compressional wave velocities.
F172. Time-depth relationship.
F173. Distribution of z-component velocity.
F174. Synthetic seismograms.
F175. Correlation of lithologic units with seismic reflection patterns.
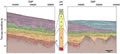
F176. SCREECH line 2MCS.
T1. Coring Summary, Site 1276.
T2. Lithostratigraphic units, Hole 1276A.
T3. XRD data, Hole 1276A.
T4. ICP-AES major and trace element analyses.
T5. Comparison of approximate sedimentation rates.
T6. ICP-AES major and trace element analysis of upper and lower sill sediments.
T7. Paleontological observations of shipboard samples, Site 1276.
T8. Cenozoic calcareous nannofossils, Site 1276.
T9. Mesozoic calcareous nannofossils, Site 1276.
T10. Benthic foraminifers, Site 1276.
T11. Palynomorphs, Site 1276.
T12. Calcareous nannofossil and dinoflagellate cyst datums, Site 1276.
T13. Calcareous nannofossil and foraminifer datums, Site 398.
T14. Paleomagnetic results.
T15. C1-C6 hydrocarbons in headspace gas.
T16. Carbonate content.
T17. Results from CNH analysis.
T18. Organic carbon and Rock-Eval pyrolysis results.
T19. Sulfate concentrations.
T20. Predicted two-way traveltimes of contacts between lithologic units.
![]() Figures F1-F20
Figures F1-F20
![]() Figures F21-F40
Figures F21-F40
![]() Figures F41-F60
Figures F41-F60
![]() Figures F61-F80
Figures F61-F80
![]() Figures F81-F100
Figures F81-F100
![]() Figures F101-F120
Figures F101-F120
![]() Figures F121-F140
Figures F121-F140
![]() Figures F141-F160
Figures F141-F160
![]() Figures F161-F176
Figures F161-F176
![]() Tables T1-T20
Tables T1-T20