![]() Figures F1–F22
Figures F1–F22
![]() Table T1
Table T1
![]() Appendix Tables AT1–AT2
Appendix Tables AT1–AT2
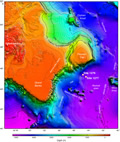
F1. Bathymetric map of Leg 210 sites.
F2. Summary stratigraphic column for Hole 1276A.

F3. Stratigraphic column for DSDP Site 398.

F4. Reconstruction of the Newfoundland–Iberia conjugate margins at 121 Ma.
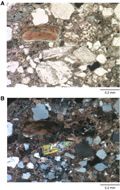
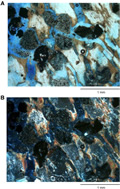
F5. Photomicrographs of Sample 210-1276A-9R-5, 118 cm.
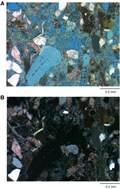
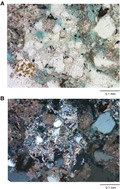
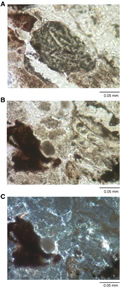
F6. Photomicrographs of Sample 210-1276A-49R-2, 130 cm.
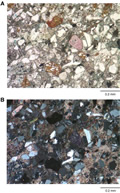
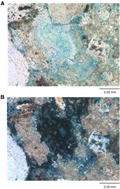
F7. Photomicrographs of Sample 210-1276A-81R-3, 134 cm.
F8. Photomicrographs of Sample 210-1276A-93R-1, 24 cm.
F9. Photomicrographs of Sample 210-1276A-90R-5, 87 cm.
F10. Ternary QFL plot of Albian and Aptian sandstone data.
F11. Ternary QFL plot of Cenomanian, Santonian, Campanian, and Maastrichtian sandstone data.

F12. Ternary QFL plot of Eocene and Paleocene sandstone data.
F13. Histograms displaying the proportions of sedimentary lithic fragments.
F14. Ternary QmKP plot of Hauterivian–Eocene sandstone data.
F15. Ternary QFL plot of Lower Cretaceous sandstone data.
F16. Ternary QFL plot of Tithonian and Jurassic sandstone data.

F17. Tectonic terrane map of Grand Banks and Iberian regions.
F18. Photomicrographs of Sample 149-897C-62R-1, 123 cm.
F19. Photomicrographs of Sample 173-1068A-7R-2, 82 cm.

F20. Photomicrographs of Sample 173-1069A-7R-2, 82 cm.
F21. QFL plots of rift and young ocean basin sand compositions.
F22. Paleogeographic reconstructions of Newfoundland–Iberian conjugate margins.

T1. Recalculated parameters.
AT1. Point-count categories.
AT2. Point-count data.
![]() Figures F1–F22
Figures F1–F22
![]() Table T1
Table T1
![]() Appendix Tables AT1–AT2
Appendix Tables AT1–AT2