![]() Figures F1-F8
Figures F1-F8
![]() Tables T1-T3
Tables T1-T3
F1. Map showing the location of ODP Site 1098.
F2. Sediment lightness at Site 1098 vs. modified composite depth.
F3. Color variables for the spliced record vs. density and number of dark laminae.
F4. Detail of L* trends in all three holes between 13 and 15.5 mcd.
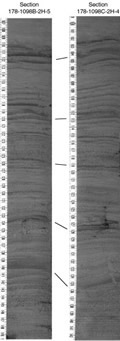
F5. Image data for Holes 1098B and 1098C.
F6. Detail of L* trends in all three holes between ~43 and 46 mcd.
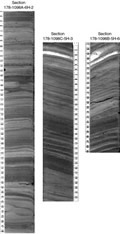
F7. Image data for Holes 1098A, 1098B and 1098C.
F8. Thicknesses of dark/light couplets and light intervals vs. average sediment accumulation rates.
T1. Hole 1098A digital image color data.
T2. Hole 1098B digital image color data.
T3. Hole 1098C digital image color data.
![]() Figures F1-F8
Figures F1-F8
![]() Tables T1-T3
Tables T1-T3