![]() Figures F1-F21
Figures F1-F21
![]() Tables
T1-T3
Tables
T1-T3
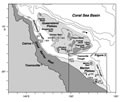
F1. Map showing DSDP Site 209 and ODP Legs 133 and 194 sites.
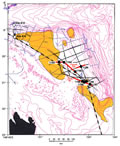
F2. Map showing ODP Legs 133 and 194 sites with multichannel seismic lines.
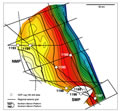
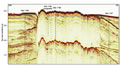
F3. Topography of acoustic basement.
F4. Water-loaded tectonic subsidence.
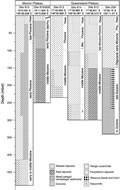
F5. Stratigraphic summary of previously cored sites near Leg 194 sites.
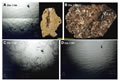
F6. Seafloor photographs.
F7. Seismic overview of characteristics of seismic megasequences, northern transect.
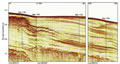
F8. Seismic overview of characteristics of seismic megasequences, southern transect.
F9. Stratigraphic correlation summary.
F10. Partial seismic sections for sites and stratigraphic correlation summary, Leg 194.
F11. Correlation between seismic two-way traveltime and depth.
F12. Sedimentation rates at Leg 194 sites.
F13. Seismic correlation between Leg 194 sites.
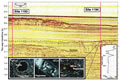
F14. Diagrams illustrating calculations of late middle Miocene eustatic fall using Sites 1193 and 1194.
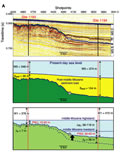
F15. Schematic diagrams reconstructing the depositional history of the Marion Plateau sequences.
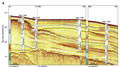
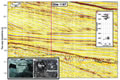
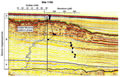
F16. Multichannel seismic reflection profile, Site 1194.
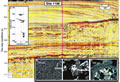
F17. Multichannel seismic reflection profile, Site 1197.
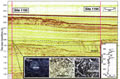
F18. Multichannel seismic reflection profile, Site 1193.
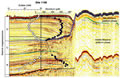
F19. Multichannel seismic reflection profile, Site 1198.
F20. Multichannel seismic line MAR07 at Site 1198.
F21. Multichannel seismic line MAR13 at Site 1193.
T1. Acquisition and processing parameters for seismic site survey data.
T2. Summary of operations.
T3. Parameters used for paleotopographic reconstructions and sea level estimates.