![]() Figures F1-F55
Figures F1-F55
![]() Tables
T1-T13
Tables
T1-T13
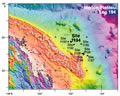
F1. Bathymetry map.
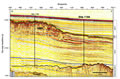
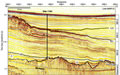
F2. Seismic line MAR13.
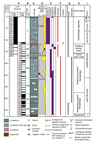
F3. Lithologic summary.
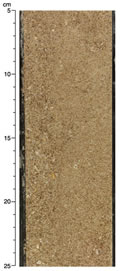
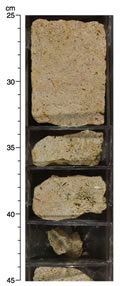
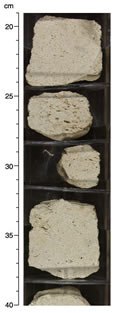
F4. Skeletal grainstone of Unit I.
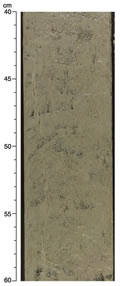
F5. Close-up photograph of Unit II.
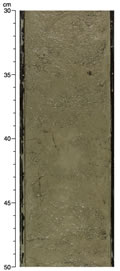
F6. Close-up photograph of scoured surfaces in Section 194-1194A-1H-1.
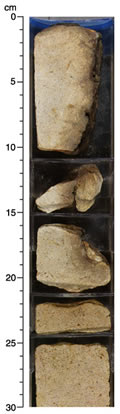
F7. Close-up photograph of hardground interval at the top of Unit III.
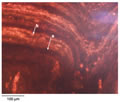
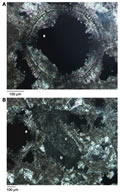
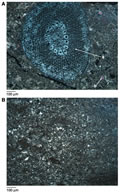
F8. Photomicrograph of the top of recovered hardground in Core 194-1194A-14X.
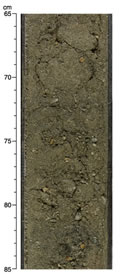
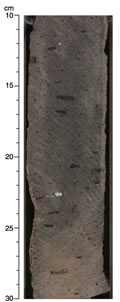
F9. Close-up photograph of dolomitized interval below the phosphatized crust of Unit III.
F10. Photomicrograph of the recovered hardground in Core 194-1194A-14X.
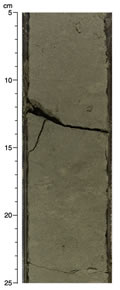
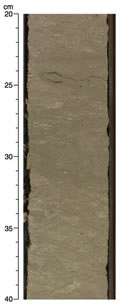
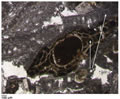
F11. Close-up photograph of skeletal floatstone of Subunit IIIA.
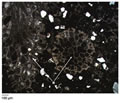
F12. Photomicrograph of the lithology of Subunit IIIA.
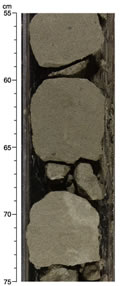
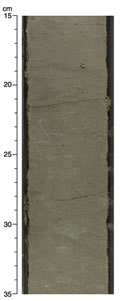
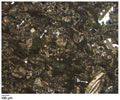
F13. Close-up photograph of skeletal packstone dominated by larger benthic foraminifers.
F14. Close-up photograph of silt-sized packstone/grainstone.
F15. Photomicrograph of Subunit IVA.
F16. Close-up photograph of the sediment of Subunit IVB.
F17. Photomicrograph of Subunit IVB.
F18. Close-up photograph of silt-sized packstone.
F19. Photomicrograph of section in Subunit VA.
F20. Close-up photograph of skeletal packstone of Subunit VB.
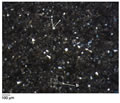
F21. Photomicrograph of skeletal components of the upper part of Subunit VB.
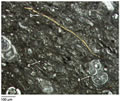
F22. Photomicrograph of lower part of Subunit VA.
F23. Close-up photograph of weathered olivine basalt.
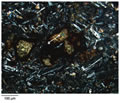
F24. Photomicrograph of the olivine basalt.
F25. Long-core measurements, 0 to 100 mbsf.
F26. Long-core measurements, 0 to 100 mbsf.
F27. Long-core measurements, 300 to 400 mbsf.
F28. Analysis of NRM by AF demagnetization.
F29. Remanent magnetism characteristics.
F30. Variation of remanent magnetism characteristics downhole.
F31. Age-depth model and sedimentation rates.
F32. Dissolved constituents vs. depth.
F33. Dissolved pore water magnesium vs. calcium.
F34. Dissolved pore water magnesium vs. sulfate.
F35. Dolomite, calcite, and noncarbonate mineral percentages.
F36. Carbon, HI, and sulfur results.
F37. Bulk density, grain density, and porosity.
F38. Compressional wave velocity and adjusted velocity.
F39. Velocity-porosity crossplot.
F40. APCT observations and temperature decay models.
F41. Thermal conductivity and downhole temperature.
F42. Thermal conductivity as a function of porosity.
F43. MS and NGR.
F44. Smoothed MS, NGR, and lightness.
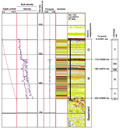
F45. Composite log for Hole 1194B.
F46. Data produced by the HSGR tool and the MGT.
F47. Correlation between the gamma ray values measured downhole and the natural gamma ray values of the MST.
F48. Comparison of core and log physical properties.
F49. Comparison of lithologic units, log units, and position of changing log signatures.
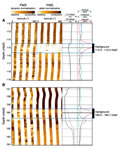
F50. Dynamic and static FMS images and NGR logs.
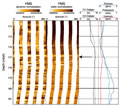
F51. Dynamic and static FMS image and NGR log across Unit III/IV boundary.
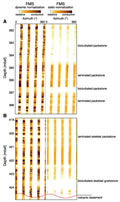
F52. Dynamic and static FMS images of basement and overlying sediments.
F53. Temperature vs. depth.
F54. Multichannel line MAR13.
F55. Synthetic seismogram plotted on MAR13 with core-to-seismic correlation.
T1. Coring summary.
T2. Expanded coring summary.
T3. Lithologic units and subunits.
T4. Biostratigraphic datums.
T5. Summary of paleoenvironmental interpretations.
T6. Age-depth control points.
T7. Age picks.
T8. Headspace gas composition.
T9. Interstitial water chemistry.
T10. Calcite, dolomite, and noncarbonate mineral percentages.
T11. Carbon, nitrogen, sulfur, and hydrogen values.
T12. Rock-Eval pyrolysis results.
T13. Summary of logging operations.