![]() Figures
F1-F15
Figures
F1-F15
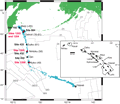
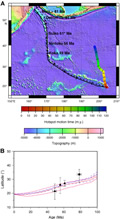
F1. Leg 197 sites in the Emperor Seamounts.
F2. Paleomagnetic inclination groups.
F3. Paleolatitude data.
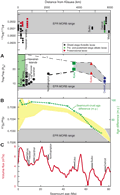
F4. Leg 197 vs. geodynamic model results.
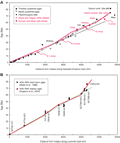
F5. Paleointensity data from submarine basaltic glass.
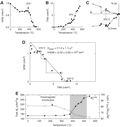
F6. First-order reversal curve.
![]()
F7. Paleointensity results from plagioclase crystals.
![]()
F8. Plagioclase crystals and whole-rock lava results.

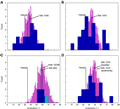
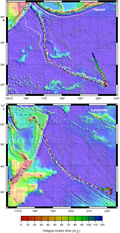
F9. Age distribution of volcanic centers.
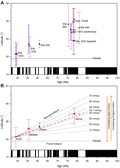
F10. Computed hotspot motion and tracks.
F11. Models of Hawaiian volcano evolution.
![]()
F12. Volcano environment.
![]()
F13. Major element variability for Hawaii vs. Emperor Seamount lavas.

F14. Nd and Pb isotopic variability.

F15. Isotopic variability along Hawaiian-Emperor volcanic lineament.