![]() Figures F1-F50
Figures F1-F50
![]() Figures F51-F85
Figures F51-F85
![]() Tables T1-T20
Tables T1-T20
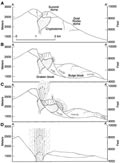
F51. Schematic drawing of a landslide and the resulting directed blast eruption.
F52. LOI vs. K2O for vitric tuffs.
F53. Ternary diagrams showing effects of addition of detrital and authigenic clays to basaltic volcaniclastic material.
F54. Major oxide discriminant diagrams.
F55. Comparison of Hole 1223A with Kilauea-Puna Ridge and Koolau tholeiites.
F56. Inclination, declination, and intensity prior to AF demagnetization.
F57. AF demagnetization results, 200-1223A-1H-1, 65 cm.
F58. AF demagnetization results, 200-1223A-6X-3, 90 cm.
F59. Magnetostratigraphy and inclinations from split cores and discrete samples.
F60. AF demagnetization results, 200-1223A-1H-2, 38 cm.
F61. AF demagnetization results, 200-1223A-1H-3, 47 cm.
F62. Orthogonal vector demagnetization plots.
F63. IRM acquisition results for two vitric tuff subsamples.
F64. Magnetostratigraphy, inclination, and declination from PCA and stable endpoints.
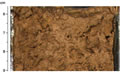
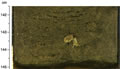
F65. Uppermost yellowish brown clay.
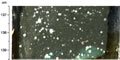
F66. Black sand layers.
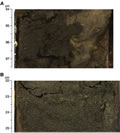
F67. Sediment characterized as volcaniclastic turbidites.
F68. Volcaniclastic silt claystone.
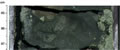
F69. Tuff layer embedded in volcaniclastic silty claystone classified as altered vitric tuff.
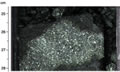
F70. Tuff layer embedded in volcaniclastic silty claystone classified as palagonitized crystal vitric tuff.
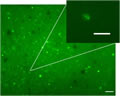
F71. Single nucleic acids containing objects and bacterial microcolonies and a DNA-stained bacterial microcolony.
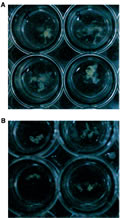
F72. Four distinct colonies obtained from altered vitric tuff cultivated under aerobic and anaerobic conditions.
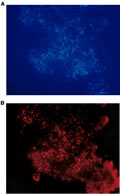
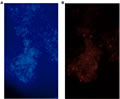
F73. Single bacterial cells within bacterial colony CFU1 after DAPI staining and hybridization with the Bacteria-specific CY3-labeled probe EUB338.
F74. Single bacterial cells within bacterial colony CFU16 after DAPI staining and hybridization with the CY3-labeled probe SRB385Db.
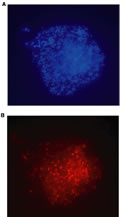
F75. Single bacterial cells of bacterial colony CFU1 after DAPI staining and hybridization with the CY3-labeled probe LGCa-c.
F76. MST GRA density, magnetic susceptibility, and NGR.
F77. Thermal conductivity vs. depth.
F78. Discrete sample bulk density, dry density, grain density, and porosity.
F79. Comparison of GRA density and bulk density.
F80. Comparison of PWL and PWS velocities.
F81. Comparison of PWS velocity to bulk density and porosity.
F82. 3.5-kHz echo soundings showing changes in the reflection sequence.
F83. Navigation plot using GPS fixes at 1-min intervals.
F84. Navigation plot of a 7-hr recording.
F85. Incremental distance between fixes at which there were noticeable changes in recording.
T1. Coring summary, Site 1223.
T2. Expanded coring summary, Site 1223.
T3. Lithologic unit descriptions, Hole 1223A.
T4. Important petrographic features of the different units, Site 1223.
T5. XRD analyses results for samples, Site 1223.
T6. Principal wavelengths and corresponding °2q of mineral peaks identified.
T7. ICP-AES analyses, Hole 1223A.
T8. Drilling-disturbed intervals and gaps.
T9. Paleomagnetic data from archive-half sections, Hole 1223A.
T10. PCA results from paleomagnetic data, Hole 1223A.
T11. Paleomagnetic data from discrete samples, Hole 1223A.
T12. ARM data from discrete samples, Hole 1223A.
T13. IRM data from discrete samples, Hole 1223A.
T14. PCA results from paleomagnetic data from discrete samples, Hole 1223A.
T15. Magnetostratigraphy, Site 1223.
T16. Ages of lithologic units, Hole 1223A.
T17. Thermal conductivity measurements, Hole 1223A.
T18. Moisture and density, Hole 1223A.
T19. PWS velocity measurements, Hole 1223A.
T20. Area insonified.
![]() Figures F1-F50
Figures F1-F50
![]() Figures F51-F85
Figures F51-F85
![]() Tables T1-T20
Tables T1-T20