![]() Figures F1-F50
Figures F1-F50
![]() Figures
F51-97
Figures
F51-97
![]() Tables T1-T9
Tables T1-T9
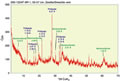
F51. XRD result for a zeolite vein.
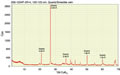
F52. XRD result for a quartz vein.
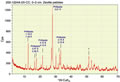
F53. XRD result of a mixed calcite and smectite vein.

F54. XRD result of zeolite pebbles in a sediment layer.
F55. Summary of sediments cored at Site 1224.
F56. Inclination, declination, and intensity prior to AF demagnetization.
F57. Inclination and intensity, Hole 1224C.
F58. AF demagnetization results from Sample 200-1224A-5X-1, 17 cm.
F59. AF demagnetization results from Sample 200-1224F-2R-1, 91 cm.
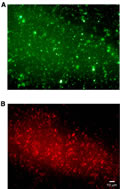
F60. Bacterial cells after DAPI staining and hybridization with the CY3-labeled probe EUB338.
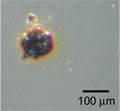
F61. Macroscopic image of Fe2+-oxidizing bacterial colony.
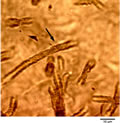
F62. Fungal hyphae divided into distinctive cells by septae.
F63. Fungal hyphae in a CaCO3-filled cavity.
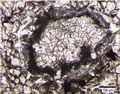
F64. Fe-oxide encrusted fungal hyphae in a carbonate-filled vein.
F65. GRA bulk density, MS, and NGR, Hole 1224C.
F66. Moisture and density measurements, Hole 1224C.

F67. Thermal conductivity, PWL and PWS, and GRA and bulk density, Hole 1224C.

F68. PWL velocity vs. GRA density, Hole 1224C.
F69. MST measurements of GRA bulk density, MS, and NGR with depth in Hole 1224D.
F70. Moisture and density measurements and thermal conductivity measurements with depth, Hole 1224D.
F71. Compressional wave velocity vs. depth, Holes 1224D, 1124E, and 1224F.
F72. Compressional wave velocity vs. bulk density and porosity, Hole 1224D.
F73. GRA bulk density, MS, and NGR, Hole 1224E.
F74. GRA bulk density, MS, and NGR, Hole 1224F.
F75. Moisture and density, Hole 1224E.
F76. Moisture and density and thermal conductivity, Hole 1224F.
F77. Compressional wave velocity vs. bulk density and porosity, Hole 1224E.
F78. Compressional wave velocity vs. bulk density and porosity, Hole 1224F.
F79. Composite log of hole parameters and magnetic field logs, Hole 1224F.
F80. Composite log of temperature, SP, and electrical resistivity logs, Hole 1224F.
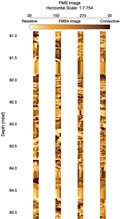
F81. FMS images, Hole 1224F.
F82. Composite log of the density, neutron porosity, and sonic logs, Hole 1224F.
F83. Composite log of the spectral gamma ray logs, Hole 1224F.
F84. Reentry cone and steel casing, Hole 1224D.
F85. Radiolarians, Hole 1224C.
F86. Logging data, Hole 1224F.
F87. PWS measurements, Hole 1224F.
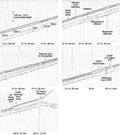
F88. Compressional wave velocity model.
F89. Ambient noise levels on the vertical component of the H2O seafloor seismometer.
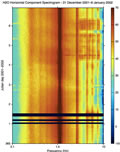
F90. Ambient noise levels on the horizontal component of the H2O seafloor seismometer.
F91. Whale songs.
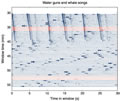
F92. Similarity between water guns and whale songs.
F93. RMS levels in octave bands on 7 January.
F94. Time series and PSD diagrams for the last earthquake.
F95. Time series and PSD diagrams for the first earthquake.
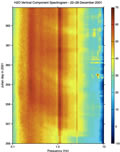
F96. RMS levels in octave bands on 25 December.
F97. RMS levels in octave bands during bit failure on 11 January.

T1. Holes drilled in "normal crust" on the Pacific plate.
T2. Coring Summary, Site 1224.
T3. Expanded coring summary.
T4. Operation synopsis, Leg 200.
T5. Summary of cooling units and alteration, Site 1224.
T6. XRD analysis samples and identified minerals.
T7. Moisture and density, Site 1224.
T8. Thermal conductivity measurements, Site 1224.
T9. PWS compressional wave velocities, Site 1224.
![]() Figures F1-F50
Figures F1-F50
![]() Figures
F51-97
Figures
F51-97
![]() Tables T1-T9
Tables T1-T9