![]() Figures F1-F41
Figures F1-F41
![]() Tables T1-T20
Tables T1-T20
F1. Map showing Site 1128 in relation to other Leg 182 sites and the AGSO169 site-survey seismic lines.
F2. Portion of seismic Line AGSO169/11e showing seismic stratigraphic sequences at Site 1128.
F3. Sediment lithostratigraphy.
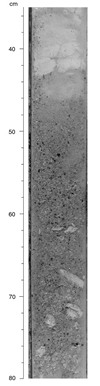
F4. A calciturbidite of planktonic foraminifers and glaucony grading up into nannofossil ooze, Subunit IA.
F5. The upper part of a sediment gravity flow, Subunit IA.
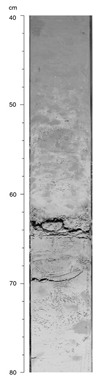
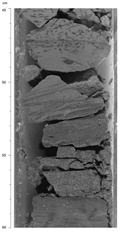
F6. Conglomerates and deformed strata, Subunit IB.
F7. Deformed strata, Subunit IB.
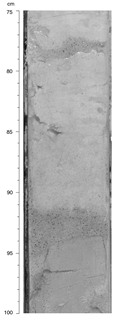
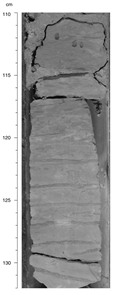
F8. Burrowed transition from white nannofossil ooze upward into bioturbated green clay, Subunit IIA.
F9. Cross-laminated glauconitic sand in the basal part of a turbidite, Unit III.
F10. Burrowed nannofossil ooze with numerous horizontal Zoophycos burrows, Unit IV.
F11. Calcareous nannofossil and planktonic foraminifer zones, and benthic foraminiferal assemblages.
F12. Sedimentation rate curve from datum levels for Site 1128.
F13. AF demagnetization behavior of soft sediment and lithified discrete samples.
F14. Plots of demagnetization of NRM, ARM, and IRM, and of the acquisition of IRM.
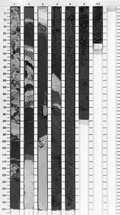
F15. Magnetic susceptibility of cores from Hole 1128B.
F16. Pliocene-Pleistocene magnetostratigraphy from Holes 1128B and 1128C.
F17. Magnetostratigraphy and correlation with the geomagnetic polarity time scale.
F18. Composite depth section produced using Splicer software.
F19. Spliced section of smoothed color reflectance data produced using Splicer software.
F20. CaCO3 and Corg contents in samples from Holes 1128B and 1128D.
F21. Concentration depth profiles.
F22. Salinity vs. Cl-.
F23. Concentration depth profiles of cations.
F24. Concentration depth profile of H4SiO4.
F25. Variations in pH and interstitial water compositions.
F26. Variations in the ratio of low-Mg calcite and quartz.
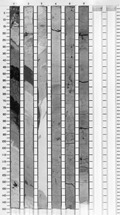
F27. P-wave velocity, bulk densities, porosity, magnetic susceptibility, and NGR measurements.
F28. NGR, magnetic susceptibility, bulk densities, and P-wave velocities from the upper 270 m at Site 1128.
F29. Downhole logging data and physical properties measurements.
F30. Sediment consolidation.
F31. Thermal conductivity and bulk density measurements.
F32. Variation of formation temperature with depth.
F33. Logging runs at Hole 1128D.
F34. Geophysical logs from the triple combo.
F35. Spectral gamma-ray logs for the open-hole logged interval.
F36. Spectral gamma-ray logs for the interval logged through pipe.
F37. Acoustic impedance log.
F38. Seismic site-survey tracks for Site 1128 in relation to other Leg 182 sites and the AGSO169 site-survey seismic lines.
F39. Portion of seismic Line AGSO169/01e showing seismic stratigraphic sequences at Site 1128.
F40. Predicted and corrected depths and interval velocities.
F41. Lithostratigraphic units, seismic sequences, biostratigraphic hiatuses, and ages.
T1. Site 1128 coring summary.
T2. Datum levels used to calculate the sedimentation rate.
T3. Site 1128 core and section depths in mcd and mbsf.
T4. Site 1128 biostratigraphic data used for correlations.
T5. Site 1128 magnetostratigraphic datums.
T6. Site 1128 splice tie points.
T7. Headspace gas compositions.
T8. CaCO3, Corg, N, and S data, Holes 1128B and 1128D.
T9. Interstitial water geochemistry.
T10. XRD data.
T11. P-wave velocity measurements.
T12. GRA densiometry measurements.
T13. Magnetic susceptibility measurements.
T14. Natural gamma-ray measurements.
T15. Thermal conductivity measurements.
T16. Discrete P-wave velocity measurements.
T17. Index properties measurements.
T18. Undrained shear strength measurements.
T19. In situ formation temperature estimates.
T20. Differences between depths to seismic horizons and corrected depths.