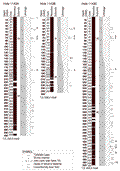
![]() Figures F1-F40
Figures F1-F40
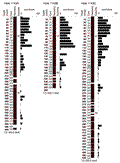
![]() Tables
T1-T15
Tables
T1-T15
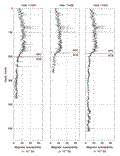
F1. Smoothed/correlated MS data and splice.
F2. Smoothed/correlated NGR data and splice.
F3. Smoothed/correlated GRA data and splice.
F4. Smoothed/correlated L* values from the CSR data and splice.
F5. Sediment summary.
F6. Green clay layer frequency.
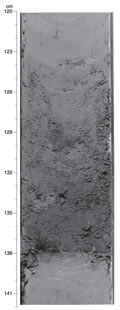
F7. Green clay layer.
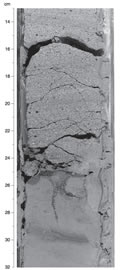
F8. Inclined unconformity with black layer.
F9. Black ash layer.
F10. Base of a coarse turbidite layer.
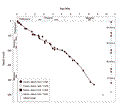
F11. Age-depth plot.
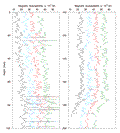
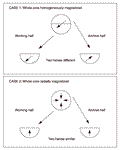
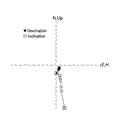
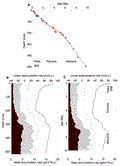
F12. Explanation of the 0o declination observation.
F13. AF demagnetization to 60 mT of Sample 184-1143A-7H-4, 93 cm.
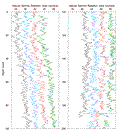
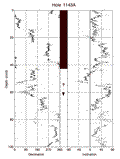
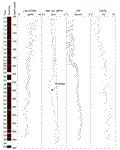
F14. Tensor-corrected declination and inclination, Hole 1143A, 0-100 mcd.
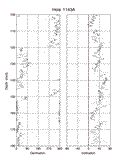
F15. Declination and inclination data, Hole 1143A, 110-185 mcd.
F16. Inclination of cores cut with a nonmagnetic and a standard cutting shoe.
F17. Age-depth model, LSR, and MAR.
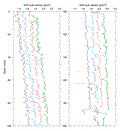
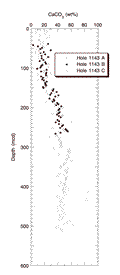
F18. Carbonate values vs. depth.
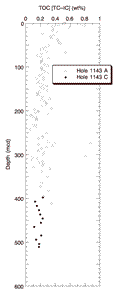
F19. Total organic carbon (by difference) values vs. depth.
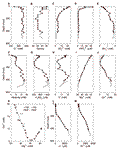
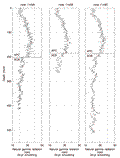
F20. Interstitial water measurements.
F21. Grain density measurements.
F22. Bulk density measurements from GRA and MAD methods.
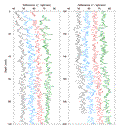
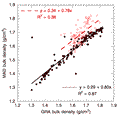
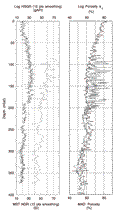
F23. Comparison of bulk density measurements from GRA and MAD methods.
F24. Porosity values obtained from the MAD method.
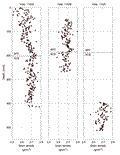
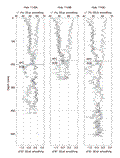
F25. Magnetic susceptibility measurements.
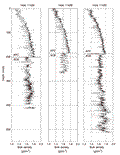
F26. Natural gamma radiation measurements.
F27. Color reflectance measurements.
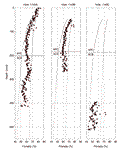
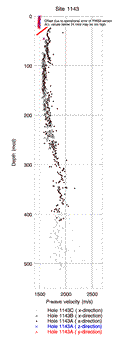
F28. P-wave velocity measurements.
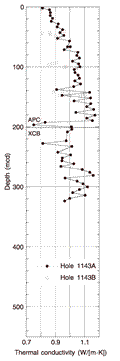
F29. Thermal conductivity measurements.
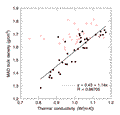
F30. Comparison of bulk density and thermal conductivity measurements.
F31. Downhole temperature measurements.
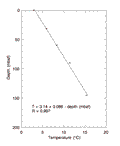
F32. Downhole temperature gradient.
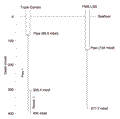
F33. Graphic summary of downhole logging operations for Hole 1143A.
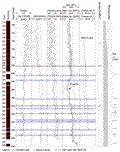
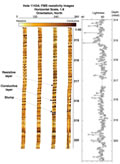
F34. Downhole logs and interpretation of FMS images from Hole 1143A.
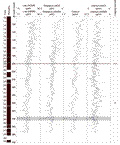
F35. Downhole logs from the HNGS tool on the triple combo tool suite.
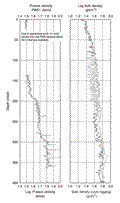
F36. Comparison of P-wave velocities with physical properties measurements.
F37. Comparison of spectral gamma ray with MST natural gamma-ray data.
F38. Comparison of the HCGR, IMPH, and PEF logs with carbonate content.
F39. FMS image displaying alternation of darker and lighter intervals.
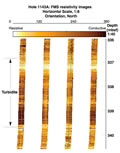
F40. FMS image displaying the major turbidite in Cores 184-1143A-37X and 38X.
T1. Site 1143 coring summary.
T2. Site 1143 coring summary by section.
T3. Site 1143 composite depths.
T4. Site 1143 splice tie points.
T5. Volcanic ash layers.
T6. Turbidite deposits.
T7. Summary of biohorizons.
T8. Calcareous nannofossil checklist.
T9. Planktonic foraminifer checklist.
T10. Sedimentation and accumulation rates for selected intervals.
T11. Corrected sediment thickness.
T12. IC, CaCO3, TC, TOC, Rock-Eval, TN, and TS contents.
T13. Interstitial water composition.
T14. Thermal conductivity measurements.
T15. Summary of logging operations at Site 1143.