![]() Figures F1-F38
Figures F1-F38
![]() Tables
T1-T16
Tables
T1-T16
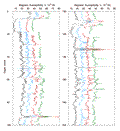
F1. Magnetic susceptibility data and splice.
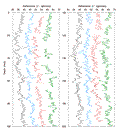
F2. Smoothed/correlated NGR data and splice.
F3. GRA data and splice.
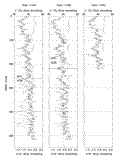
F4. Smoothed/correlated L* values from the CSR data and splice.
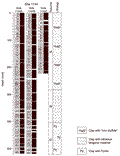
F5. Site 1144 recovery and lithology.
F6. Hole 1144A bulk mineralogy.
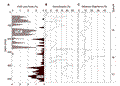
F7. Abundance of "FeS" and pyrite, nannofossil content, and total siliceous organisms.
F8. Site 1144 identified volcanic ash layers.
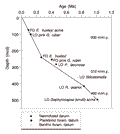
F9. Age-depth plot.
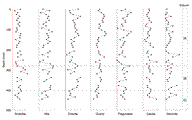
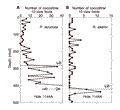
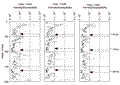
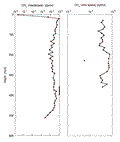
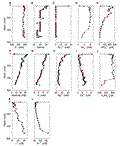
F10. Relative abundance variations.
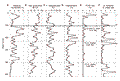
F11. Downhole biostratigraphic changes.
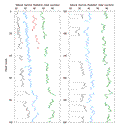
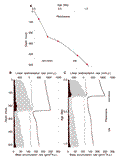
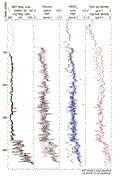
F12. Intensity of magnetization and low-field magnetic susceptibility, Hole 1144A.
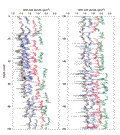
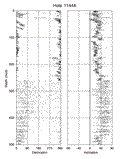
F13. Declination and inclination for Hole 1144A, 0-500 mcd.
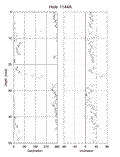
F14. Enlarged view of the declination and inclination for Hole 1144A, 0-50 mcd.
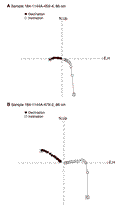
F15. AF demagnetization to 70 mT of Samples 184-1144A-45X-4, 86 cm, and 47X-2, 86 cm.
F16. Preliminary normalized intensity.
F17. Age-depth model, LSR, and MAR.
F18. Methane concentration vs. depth.
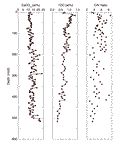
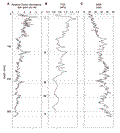
F19. Carbonate, TOC, and organic C/N ratio vs. depth.
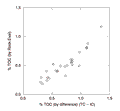
F20. TOC by Rock-Eval pyrolysis vs. TOC by difference.
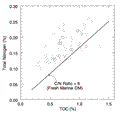
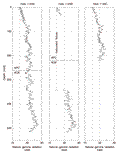
F21. TOC (by difference) vs. TN.
F22. Chlorin abundance, TOC, and NGR vs. depth.
F23. Interstitial water measurements.
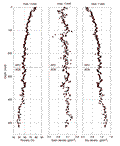
F24. Bulk density measurements from GRA core logging and MAD methods.
F25. Natural gamma radiation from core logging for Holes 1144A, 1144B, and 1144C
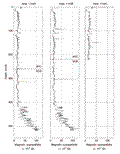
F26. Magnetic susceptibility from core logging for Holes 1144A, 1144B, and 1144C.
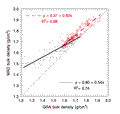
F27. Comparison of bulk density measurements from GRA and MAD methods at Hole 1144A.
F28. Porosity, grain density, and dry density from MAD measurements at Hole 1144A.
F29. Color spectral reflectance measurements.
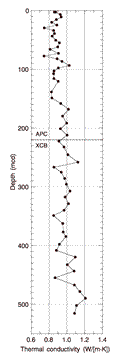
F30. Thermal conductivity measurements for Hole 1144A.
F31. Downhole temperature measurements.
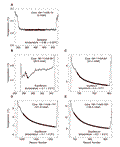
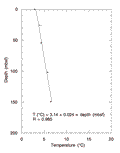
F32. Downhole temperature gradient.
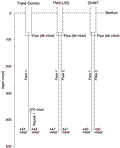
F33. Graphic summary of downhole logging operations for Hole 1144A.
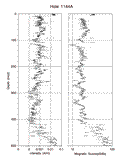
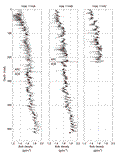
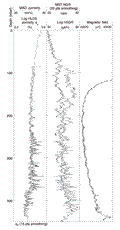
F34. Downhole logs in Hole 1144A.
F35. Comparison of MAD porosity, downhole log bulk density porosity, and NGR.
F36. Downhole logs of HSGR, HCGR, potassium, thorium, and uranium.
F37. MS from MST measurements of core logs vs. downhole measurements of thorium.
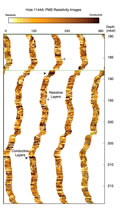
F38. FMS image from downhole logging data.
T1. Site 1144 coring summary
T2. Site 1144 coring summary by section.
T3. Composite depths for Site 1144.
T4. Site 1144 splice tie points.
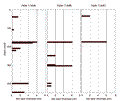
T5. Volcanic ash layers.
T6. Summary of biohorizons.
T7. Calcareous nannofossil checklist.
T8. Planktonic foraminifer checklist.
T9. Sedimentation and accumulation rates for selected intervals.
T10. Methane concentrations by headspace and void-space analysis.
T11. IC, CaCO3, TC, TOC, TN, and TS contents.
T12. Rock-Eval pyrolysis results.
T13. Chlorin concentration per gram dry weight.
T14. Interstitial water composition.
T15. Thermal conductivity measurements.
T16. Summary of logging operations.