![]() Figures F1-F43
Figures F1-F43
![]() Tables
T1-T12
Tables
T1-T12
![]() Table
AT1
Table
AT1
F1. Location of Site 1167 on the axis of the Prydz Channel Fan.
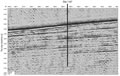
F2. Part of seismic line AGSO 149/0901 through Site 1167.
F3. Lithostratigraphic units and facies.
F4. Composite stratigraphic section showing core recovery, a simplified summary of lithology, age, lonestone, XRD, and color reflectance data.
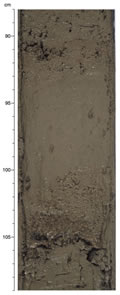
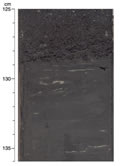
F5. Clay and sandy clay typical of Unit I.
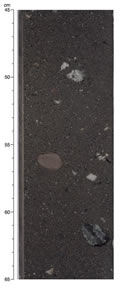
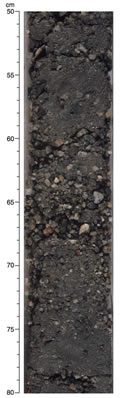
F6. Silty sand with dispersed clasts typical of Facies II-1.
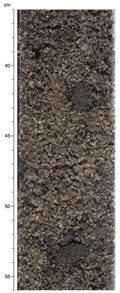
F7. Lonestone lithologies and distribution in Hole 1167A.
F8. Distribution and frequency of sandstone vs. granite/igneous lonestones in Hole 1167A.
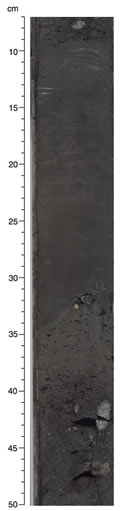
F9. Gravel bed from Facies II-1.
F10. Example of dark gray and dark reddish gray color banding.
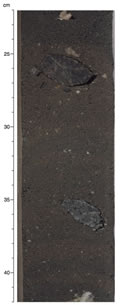
F11. Facies II-2 coarse sand with dispersed mud clasts.
F12. Facies II-3 clay with silt laminae.
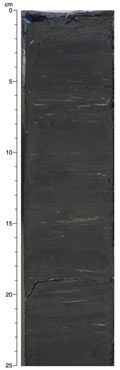
F13. Sharp contacts at the top of Facies II-3 clay.
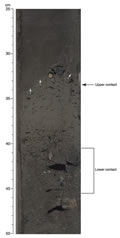
F14. Sharp contact at the top and gradational contact at the base of Facies II-4 clay.
F15. Typical succession of coarse- and fine-grained facies.
F16. Percentages of sand, silt, and clay from smear slides.
F17. X-ray diffractograms of clay-sized fractions of sediment from Cores 188-1167A-1H and 5X.
F18. X-ray diffractograms of clay-sized fractions of sediment from Core 188-1167A-25X.
F19. X-ray diffractograms of clay-sized fractions of sediment from Cores 188-1167A-10X, 14X, and 48X.
F20. Core recovery, lithostratigraphic units, magnetostratigraphy, and biostratigraphic zones for Hole 1167A.
F21. Downcore variation of concentration-dependent parameters.
F22. Plot of IRM acquisition of 10 representative samples.
F23. Downcore variation of ARM/IRM.
F24. Vector component diagrams of demagnetization (AF) behavior of four samples from Hole 1167A.
F25. Magnetostratigraphic record from Hole 1167A.
F26. Interstitial water chemistry profiles vs. depth.
F27. Weight percent inorganic carbon and organic carbon in sediments.
F28. GRA bulk-density, PWL, MS, and NGR measurements from Hole 1167A.
F29. Bulk mineralogy from XRD, NGR, and binned natural gamma spectra vs. depth.
F30. Grain density and porosity from discrete measurements.
F31. Bulk density and dry density from discrete measurements.
F32. Water content and void ratio from discrete measurements.
F33. GRA bulk-density data vs. bulk density from MAD measurements.
F34. Discrete velocity measurements obtained with the PWS.
F35. Measurements of undrained shear strength using the AVS, FC, and PP.
F36. Normalized undrained shear strength with respect to effective overburden pressure.
F37. Thermal conductivity measurements.
F38. Measured temperature vs. time from deployment of the Adara temperature tool for Core 188-1167A-4H.
F39. Measured and estimated temperature vs. depth profile.
F40. Logging summary diagram.
F41. Gamma-ray, resistivity, density, and porosity logs.
F42. Gamma-ray and resistivity logs and core susceptibility.
F43. Downhole temperatures from the TAP tool.
T1. Coring summary.
T2. Expanded coring summary.
T3. List of lonestone and dispersed granules.
T4. Abundance of foraminifers in samples, Hole 1167A.
T5. Interstitial water chemistry from shipboard measurements.
T6. Carbon, nitrogen, and sulfur analyses of sediments.
T7. Organic carbon and Rock-Eval pyrolysis on selected samples.
T8. Discrete P-wave measurements.
T9. Measurements of undrained shear strength.
T10. Measurements of thermal conductivity.
T11. Measured and estimated temperatures, geothermal gradients, and heat-flow estimates.
T12. Logging operations summary.
AT1. Summary of accessory components.
![]() Figures F1-F43
Figures F1-F43
![]() Tables
T1-T12
Tables
T1-T12
![]() Table
AT1
Table
AT1