![]() Figures F1-F54
Figures F1-F54
![]() Tables
T1-T23
Tables
T1-T23
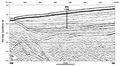
F1. Postdrilling interpretation for local seismic profile SO36-47, across Site 1168, showing broad ages and lithostratigraphic units.
F2. A portion of the seismic line Sonne SO36-47 through Site 1168.
F3. Regional cross section through time across Site 1168.
F4. Lithologic units and chronology.
F5. Lithostratigraphic summary.
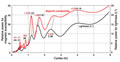
F6. Correlation between lightness and coulometric carbonate data, Hole 1168A.
F7. Sediment composition, Hole 1168A.
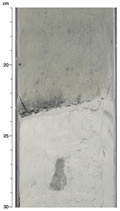
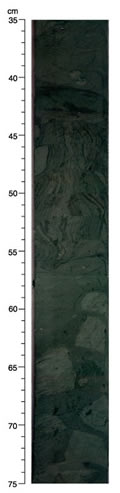
F8. Close-up photograph of greenish gray sandy layers in the light greenish gray nannofossil ooze of Subunit IA.
F9. High-resolution lightness data presumably of Pliocene-Pleistocene age, Hole 1168A.
F10. Power spectra of the interval from 2 to 23 mbsf, Hole 1168A.
F11. Comparison of the B chromaticity coordinate and magnetic susceptibility, Hole 1168A.
F12. High-resolution record of lightness, Hole 1168A.
F13. Comparison of lightness and magnetic susceptibility, Hole 1168A.
F14. Power spectra of intervals, Hole 1168A.
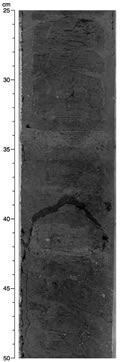
F15. Photograph showing a fluid escape structure and associated brecciated sediments.
F16. Photograph showing layers of glauconitic clayey siltstone in Unit IV.
F17. Clay mineral units.
F18. Late Eocene paleogeography and paleoenvironment.
F19. Age-depth plot and linear sedimentation rates.
F20. Paleodepth and bottom-water conditions, based largely on benthic foraminifers.
F21. Siliceous microfossil abundance and preservation vs. H4SiO40 in pore water, Hole 1168A.
F22. Long-core magnetic inclination and intensity for the uppermost 50 mbsf, Holes 1168A, 1168B, and 1168C.
F23. Long-core magnetic inclination and intensity, Hole 1168A between 250 and 350 mbsf.
F24. Principal component analysis of NRM of Sample 189-1168A-34X-CC, 25 cm.
F25. Magnetic characterization of Samples 189-1168A-30X-4, 104 cm, and 36X-6, 145 cm.
F26. Smoothed spectral reflectance, magnetic susceptibility, and GRA bulk density data for the upper 130 mcd.
F27. Plots of CaCO3, TOC, and total nitrogen, C/N ratios, and HI values, Hole 1168A.
F28. Total sulfur contents compared to C/S ratios, Hole 1168A.
F29. Tmax values generated from Rock-Eval pyrolysis analyses of organic matter, Hole 1168A.
F30. TOC vs. CaCO3 for sediments, Hole 1168A.
F31. Methane concentrations, methane vs. ethane and propane ratios, and percent wetness from headspace gas analysis.
F32. Concentration-depth profiles of interstitial water chemistry with the approximate lithostratigraphic boundaries.
F33. Concentration-depth profiles of Ca2+, Sr2+, Mg2+, Li+, and K+ normalized to Cl-.
F34. Concentration of Ca2+ compared to weight percent CaCO3.
F35. Concentration of dissolved silica within interstitial waters compared to siliceous sponge spicule abundance, Hole 1168A.
F36. GRA and wet bulk density vs. depth, Hole 1168A.
F37. P-wave velocities measured for discrete samples and in whole cores vs. depth, Hole 1168A.
F38. P-wave velocities explained and measured for discrete samples vs. depth.
F39. Thermal conductivity vs. depth measured on whole cores.
F40. Wet bulk density, water content, and porosity measured at discrete intervals vs. depth, Hole 1168A.
F41. Penetration temperature record from the Adara tool deployment in Core 189-1168A-12H.
F42. Temperature vs. depth plot.
F43. Undrained shear strength from miniature vane-shear measurements and GRA density vs. depth, Hole 1168A.
F44. Details of the logging operations, Hole 1168B.
F45. Caliper, gamma-ray, resistivity, and magnetic susceptibility values, Hole 1168A.
F46. Velocity, density, porosity, and photoelectric effect values, Hole 1168A.
F47. Total gamma-ray and spectral gamma-ray values, Hole 1168A.
F48. Intervals from the logs where hole conditions were particularly poor.
F49. Downhole log bulk density plotted with core bulk density.
F50. Downhole density porosity and neutron porosity plotted with core porosity.
F51. Downhole P-wave velocities from the DSI logs plotted with the P-wave velocities measured vertically on half cores.
F52. Core and log magnetic susceptibility data, Holes 1168A and 1168C.
F53. Sonic two-way traveltime curve.
F54. Downhole Th/U ratios, Hole 1168A.
T1. Coring summary.
T2. Identification and abundance of nannofossils.
T3. Calcareous nannofossil datum levels and their assigned age estimates.
T4. Calcareous nannofossil datum levels.
T5. Planktonic foraminifer bioevents and their ages.
T6. Range chart of planktonic foraminifers.
T7. Radiolarian datums recognized in Hole 1168A.
T8. Radiolarian datum recognized in Hole 1168C.
T9. Distribution and abundance of diatoms and silicoflagellates.
T10. Distribution of organic walled dinocysts and sporomorph percentages, Hole 1168A.
T11. Selected age-diagnostic dinocyst events, Hole 1168A.
T12. Biostratigraphic events.
T13. Magnetostratigraphic results, Holes 1168A and 1168C.
T14. Composite depth section.
T15. Splice tie points.
T16. Values for inorganic carbon, calcium carbonate, total carbon, total organic carbon, total nitrogen, total sulfur, and hydrogen in sediments, Hole 1168A.
T17. Results of Rock-Eval pyrolysis analyses on sediments, Hole 1168A.
T18. Headspace gas composition, Hole 1168A.
T19. Interstitial water data.
T20. P-wave velocities, Hole 1168A.
T21. Thermal conductivity measured on whole-core sections, Hole 1168A.
T22. Undrained shear strength from miniature vane-shear measurements, Hole 1168A.
T23. Moisture and density measured at discrete intervals, Hole 1168A.