![]() Figures F1-F48
Figures F1-F48
![]() Tables
T1-T25
Tables
T1-T25
F1. Postdrilling interpretation for local seismic profile AGSO 125-14 across Site 1170.
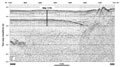
F2. A portion of seismic line Tasmante 125-14 through Site 1170.
F3. Regional cross section through time across Site 1170.
F4. Summary of biozonation, lithostratigraphic units, and physical properties.
F5. Detailed summary of biozonation, lithostratigraphic units, and physical properties.
F6. Smear slide-based lithologic composition of Hole 1170A sediments.
F7. Smear slide-based lithologic composition of Hole 1170D sediments.
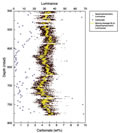
F8. Eocene oscillations in carbonate content and spectrophotometric lightness, Hole 1170D.
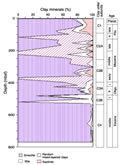
F9. Clay mineral units.
F10. Age-depth plot and linear sedimentation rates.
F11. Combined bioevents for the Eocene-Oligocene transition, Hole 1170D.
F12. Alternative age interpretations for the Eocene-Oligocene transition, Hole 1170D.
F13. Evolution of the depositional setting.
F14. Comparison of Deflandrea spp. and estimates of diatom abundance, Hole 1170D.
F15. Distribution of the organic walled dinocyst dominated taxa and indications of dominances of other (phyto)plankton groups, Hole 1170D.
F16. Long-core measurements from 0 to 100 mbsf.
F17. Long-core measurements from 100 to 200 mbsf.
F18. Long-core measurements from 250 to 450 mbsf.
F19. Long-core measurements for Section 189-1170D-9R-1 inclination and intensity before and after AF demagnetization.
F20. Long-core measurements from 425 to 779.8 mbsf.
F21. Remanent magnetic characteristics of samples from nannofossil ooze, nannofossil chalk, and claystone.
F22. Variation of magnetic properties, Holes 1170A and 1170D.
F23. Age-depth relationship from paleomagnetic data.
F24. Smoothed spectral reflectance, magnetic susceptibility, and GRA bulk density data, Holes 1170A, 1170B, and 1170C.
F25. Plots of carbonate, total organic carbon, total nitrogen, C/N and H/C ratios, and hydrogen index values.
F26. Total sulfur contents compared to C/S ratios.
F27. Tmax values generated from Rock-Eval pyrolysis analyses of organic matter.
F28. Methane concentrations, methane vs. ethane and propane ratios, and percent wetness from headspace gas analysis.
F29. Concentration-depth profiles for interstitial water chemistry.
F30. Concentration-depth profile of Sr2+/Ca2+ and interstitial water Ca2+ plotted vs. weight percent CaCO3.
F31. Magnetic susceptibility, GRA density, wet bulk density, and natural gamma ray vs. depth, Holes 1170A and 1170D.
F32. P-wave velocities measured for discrete samples and in whole cores vs. depth, Hole 1170A.
F33. P-wave velocities (PWS3) measured for discrete samples vs. depth, Holes 1170A and 1170D.
F34. Thermal conductivity measured on whole cores vs. depth, Hole 1170A.
F35. Wet bulk density, water content, and porosity measured at discrete intervals vs. depth.
F36. Temperature vs. depth.
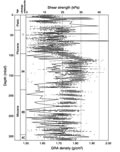
F37. Undrained shear strength from miniature vane-shear measurements and GRA density vs. depth, Hole 1170A.
F38. Details of the logging operations, Hole 1170D.
F39. Caliper, gamma-ray, resistivity, and magnetic susceptibility values, Hole 1170D.
F40. Velocity, density, porosity, and photoelectric effect values, Hole 1170D.
F41. Total gamma-ray and spectral gamma-ray values, Hole 1170D.
F42. Downhole log bulk density plotted with core bulk density.
F43. Downhole density porosity and neutron porosity plotted with core porosity.
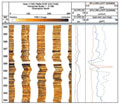
F44. FMS image from the top of log Unit 2 with caliper, SGR, SFLU, and APLC data from the triple combo.
F45. Downhole P-wave velocities from the logs plotted with the P-wave velocities measured vertically on half cores.
F46. Spectral gamma-ray data and preliminary spectral analysis from Hole 1170D.
F47. Magnetic susceptibility, Th, total organic carbon, hydrogen index value, and U data, Hole 1170D.
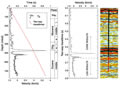
F48. Time/depth, sonic velocity, and seismic data.
T1. Coring summary.
T2. Summary of Site 1170 lithology and corresponding lithostratigraphic units for Site 1168 and DSDP Site 281.
T3. Calcareous nannofossil datum levels.
T4. Stratigraphic distribution of selected nannofossil species.
T5. Planktonic foraminiferal datums, Hole 1170A.
T6. Range chart of planktonic foraminifers.
T7. Radiolarian datums.
T8. Relative abundance of selected taxa, sponge spicules, and silicoflagellates, Hole 1170A.
T9. Diatom bioevents identified, Holes 1170A and 1170D.
T10. Distribution of organic walled dinocysts and sporomorph percentages, Hole 1170A.
T11. Useful stratigraphic dinocyst events, Holes 1170A and 1170D.
T12. Distribution of organic walled dinocysts and palynomorph group percentages, Hole 1170D.
T13. Biostratigraphic events.
T14. Magnetostratigraphic results.
T15. Composite depth section for the APC interval.
T16. Splice tie points.
T17. Values for inorganic carbon, calcium carbonate, total carbon, total organic carbon, total nitrogen, total sulfur, and hydrogen in sediments, Hole 1170A.
T18. Results of Rock-Eval pyrolysis analyses on sediments, Hole 1170A.
T19. Headspace gas composition.
T20. Interstitial water data.
T21. P-wave velocities measured at discrete intervals, Hole 1170A.
T22. P-wave velocities measured at discrete intervals across the core, Hole 1170D.
T23. Thermal conductivity measured on whole core sections, Hole 1170A.
T24. Undrained shear strength from miniature vane-shear measurements, Hole 1170A.
T25. Index properties measured at discrete intervals.