![]() Figures F1-F40
Figures F1-F40
![]() Figures
F41-F79
Figures
F41-F79
![]() Tables
T1-T21
Tables
T1-T21
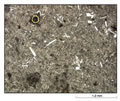
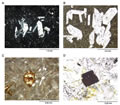
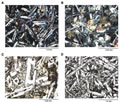
F41. Photomicrograph of basalt at the top of basement.
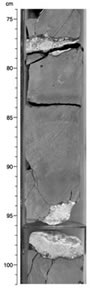
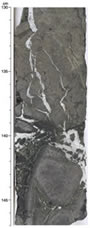
F42. Close-up of a liesegang structure in a basalt flow of Unit 1.
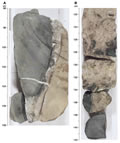
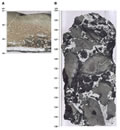
F43. Pillow and interpillow materials.
F44. Interpillow or interflow volcaniclastic sediment, Unit 3.
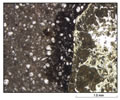
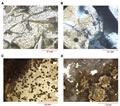
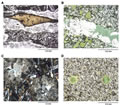
F45. Photomicrograph of calcified radiolarian fossils and basalt fragments.
F46. Basaltic breccia with hyaloclastite and pillow breccia.
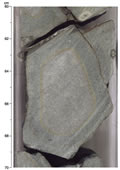
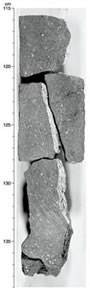
F47. Calcite- and saponite-filled vesicles in a massive flow.
F48. Pillows with altered glassy shard and interpillow materials.
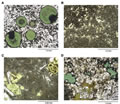
F49. Photomicrographs showing phenocrysts in basalts.
F50. Photomicrographs showing accessory minerals and microcrystalline texture in basalts.
F51. Photomicrographs showing groundmass textures of basalt.
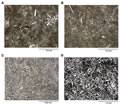
F52. Photomicrographs showing representative textures of basalts.
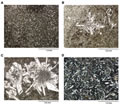
F53. Photomicrographs showing fine-grained groundmass textures of basalts.
F54. FeO*/MgO vs. TiO2 plot for basalts.
F55. Photomicrographs showing secondary minerals palagonite, calcite, celadonite, smectite, and zeolite in basalts.
F56. Photomicrographs showing secondary minerals celadonite, collomorphic FeOOH/hematite, and smectite in basalts.
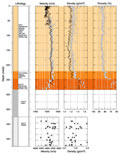
F57. Variations of P-wave velocity, bulk density, and porosity with depth.
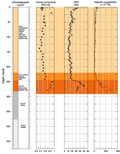
F58. Variations of thermal conductivity, natural gamma radiation, and magnetic susceptibility with depth.
F59. Variation of bulk density with depth in Unit I.
F60. Variation of peak shear strength with depth in Unit I.
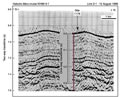
F61. Multichannel seismic profile across Site 1179 (line 2-1).
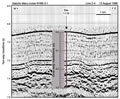
F62. Multichannel seismic profile across Site 1179 (line 2-4).
F63. NGR measurements compared with lithostratigraphic units.
F64. Comparison between the HNGS and the MGT.
F65. Electrical resistivity measurements compared with lithostratigraphic units.
F66. Acceleration along the x- and y-axes.
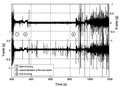
F67. Heave recorded during APC coring.
![]()
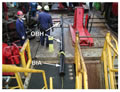
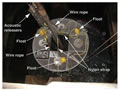
F68. Borehole instrument assembly on the rig floor.
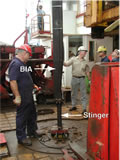
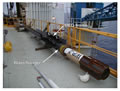
F69. Stinger pipe jointed to the lower end of the borehole instrument assembly.
F70. Borehole instrument assembly in the moonpool area.
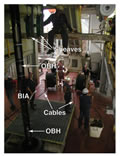
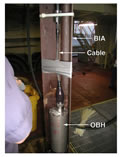
F71. Instrument cable connected to the OBH.
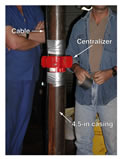
F72. Centralizer attached on the 4.5-in casing pipe.
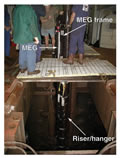
F73. MEG frame mounted on the riser/hanger.
F74. MEG-191 installed on the MEG frame.
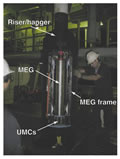
F75. MEG-191 on the riser/hanger, lowered into the moonpool.
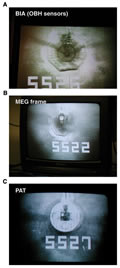
F76. Snapshots from the VIT/subsea TV camera.
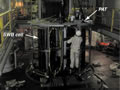
F77. Preparations for the deployment of the PAT battery frame.
F78. Schematic diagram of the PAT bridle assembly.
F79. PAT battery frame lowered into the sea through the moonpool.
T1. Coring summary.
T2. Sediment carbon, nitrogen, sulfur, and hydrogen results, Site 1179.
T3. Radiolarian range chart.
T4. Core samples collected for microbiological and chemical analyses.
T5. Magnetic susceptibility tie point depths, Holes 1179A, 1179B, and 1179C.
T6. Magnetic polarity reversal boundary depths, Holes 1179B and 1179C.
T7. Subdivision of the basalt recovered from Hole 1179D.
T8. Phenocryst distribution in basalts, Hole 1179D.
T9. Glass/palagonite contents of basalts, Hole 1179D.
T10. Chemical analyses of basalts, Hole 1179D.
T11. CIPW norm composition of basalts, Hole 1179D.
T12. PWS3 split-core P-wave velocities.
T13. Index properties of discrete samples, Holes 1179A-1179C.
T14. Thermal conductivity values.
T15. Densities and P-wave velocities in basalts.
T16. Average physical properties by lithostratigraphic unit.
T17. Vane shear data.
T18. Correlation of reflection traveltime with the lithostratigraphic column using measured P-wave velocities.
T19. Correlation of reflection traveltime with the lithostratigraphic column.
T20. Instrument package deployment.
T21. ROV tasks to start the NEREID-191 system.
![]() Figures F1-F40
Figures F1-F40
![]() Figures
F41-F79
Figures
F41-F79
![]() Tables
T1-T21
Tables
T1-T21