![]() Figures F1-F40
Figures F1-F40
![]() Figures
F41-F79
Figures
F41-F79
![]() Tables
T1-T21
Tables
T1-T21
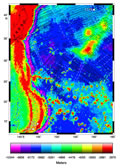
F1. Location map of seismic station coverage in the northwest Pacific.
F2. Locations of Leg 191 drill sites.
F3. Magnetic anomalies in the vicinity of Site 1179.
F4. Comparison of stratigraphic sections from DSDP and ODP holes drilled in the northwest Pacific.
F5. Relative positions of holes drilled at Site 1179.
F6. Site survey cruise tracks.
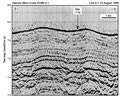
F7. Multichannel seismic line corresponding to A-A´.
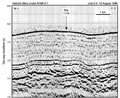
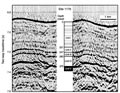
F8. Multichannel seismic line corresponding to B-B´.
F9. Echo-sounder profile corresponding to C-C´.
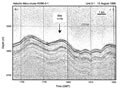
F10. Correlation between seismic line A-A´, the lithostratigraphic column, and predicted depths of unit boundaries.
F11. Lithologic column divided into four lithostratigraphic units based on color and composition.
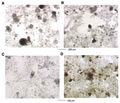
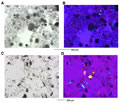
F12. Photomicrographs revealing characteristic lithologic components of Units I, II, and III.
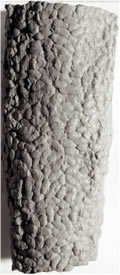
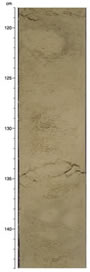
F13. Characteristic appearance of the clay- and radiolarian-bearing diatom ooze of Unit I.
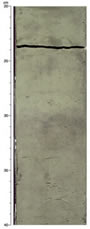
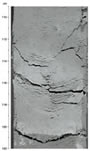
F14. Thin to thick beddinglike features of Unit I.
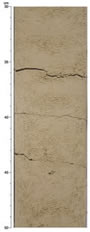
F15. Planar laminae of Unit I.
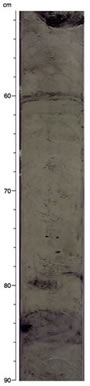
F16. Vertical distribution pattern of bioturbation of Unit I.
F17. Indurated burrow fill (cf. Ophiomorphia) of Unit I.
F18. Photomicrographs documenting accessory lithologies of Unit I.
F19. Ash layer accessory lithology of Unit I.
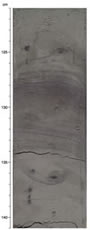
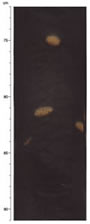
F20. Characteristic appearance of the radiolarian ooze of Unit II.
F21. Isolated bioturbation marks of Unit II.
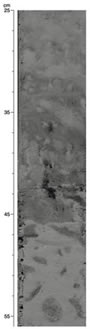
F22. Characteristic appearance of the pelagic clay of Unit III.
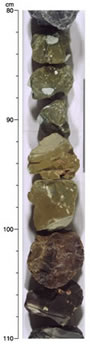
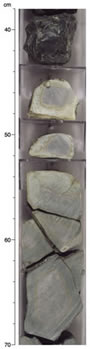
F23. Coloration of chert pieces of Unit IV.
F24. Ages of sediment.
F25. Dinoflagellate cyst distribution.
F26. Concentration profile of dissolved NH4+.
F27. Concentration profiles of dissolved Mn(II) and Fe(II).
F28. Concentration profile of dissolved SO42-.
F29. Standard log-log curve of PFT concentration vs. GC/ECD peak area.
F30. NRM intensity before and after AF demagnetization.
F31. NRM of the drill-string overprint before and after AF demagnetization.
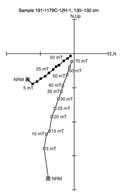
F32. Zijderveld plot of Sample 191-1179C-12H-1, 130-132 cm.
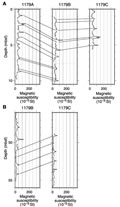
F33. Magnetic susceptibility vs. depth.
F34. Magnetic susceptibility correlations.
F35. Magnetic polarity reversal sequence (after AF demagnetization).
F36. Zijderveld plots of basalt samples.
F37. Sedimentation rate curve based on magnetostratigraphy.
F38. Sedimentation rates based on radiolarians, dinoflagellate cysts, foraminifers, and nannofossils.
F39. Basement stratigraphy and unit boundaries.
F40. Highly altered aphyric basalt flow margin covered by brown chert.
![]() Figures F1-F40
Figures F1-F40
![]() Figures
F41-F79
Figures
F41-F79
![]() Tables
T1-T21
Tables
T1-T21