![]() Figures F1-F62
Figures F1-F62
![]() Tables
T1-T20
Tables
T1-T20
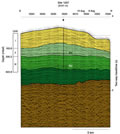
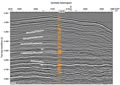
F1. Interpretation of seismic reflection profile, Site 1207.
F2. Coring results, Hole 1207A.
F3. Changes in ocean circulation that led to cycles in upper Miocene to Holocene section.
F4. Hypothesized sequence of events that produced major Campanian-Miocene unconformity, Northern High of Shatsky Rise.
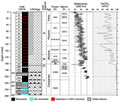
F5. Core recovery, lithologic units, age with biostratigraphic zonations, color reflectance, and percent carbonate, Hole 1207A.
F6. Core recovery, lithologic units, and age with corresponding biostratigraphic zonations.
F7. Estimates of biosiliceous material, Hole 1207A.
F8. Percent total color reflectance and percent carbonate, Hole 1207A.
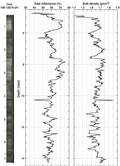
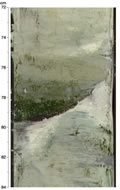
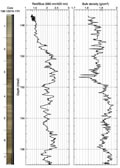
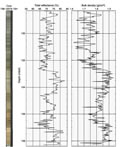
F9. Composite digital photograph, color reflectance, and bulk density, Core 198-1207A-2H.
F10. Composite digital photograph, color reflectance, and bulk density, Core 198-1207A-5H.
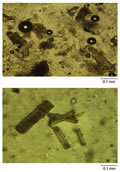
F11. Visible pyrite blebs.
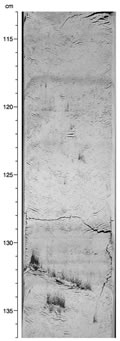
F12. Diagenetic laminae, light to dark cyclicity, mottled fabric, and pyrite blebs.
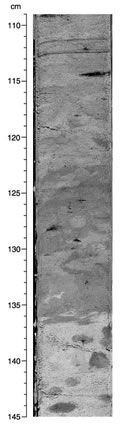
F13. Scour surface overlain by dark greenish gray volcanic ash.
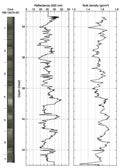
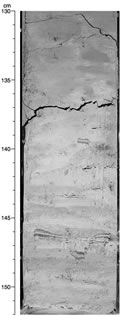
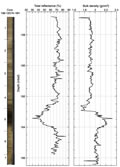
F14. Composite digital photograph, color reflectance, and bulk density, Core 198-1207A-17H.
F15. Zoophycos burrows.
F16. Composite digital photograph, color reflectance, and bulk density, Core 198-1207A-18H.
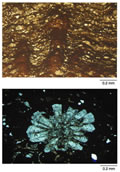
F17. Concentrations of tan/brown phillipsite crystals from the Miocene condensed zone.
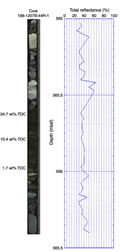
F18. Lower Aptian "Selli" level, a Corg-rich claystone, with total reflectance and organic carbon determinations.
F19. Manganese crust from the Miocene condensed section.
F20. Rim of chert fragment recovered within soupy white Campanian ooz.
F21. Turonian nannofossil limestone/chalk with radiolarians.
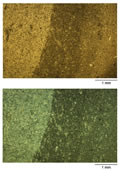
F22. Transition from nannofossil chalk to porcellanite to calcareous chert.
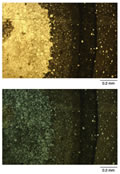
F23. Fragment of dark reddish foraminifer-radiolarian chert/porcellanite, Albian section.
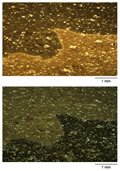
F24. Zoned chert nodule from an Aptian section.
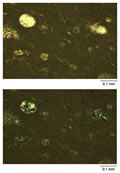
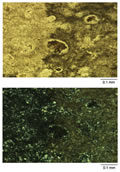
F25. Higher magnification view of contact between chert and porcellanite.
F26. Detrended color reflectance vs. age for the Pliocene-Pleistocene, with superimposed predicted angle of obliquity.
F27. Composite digital photograph, color reflectance, and bulk density, Core 198-1207A-15H.
F28. Archive-half magnetization intensities after AF demagnetization at peak fields of 20 mT, Hole 1207A.
F29. Inclination after AF demagnetization at peak fields of 20mT, Hole 1207A.
F30. Age-depth curve derived from magnetic stratigraphy.
F31. Age-depth plot of calcareous nannofossils and planktonic foraminiferal datums.
F32. Age-depth plot of Neogene calcareous nannofossil and planktonic foraminiferal datums, Hole 1207A.
F33. Age-depth plot of Cretaceous calcareous nannofossil and planktonic datums.
F34. Mass accumulation rates vs. depth and age for the Neogene, Hole 1207A.
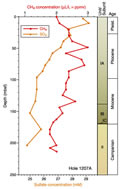
F35. CH4 and sulfate profiles.
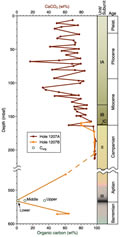
F36. Downhole profiles of carbonate content and organic carbon contents.
F37. Oxygen and hydrogen indices.
F38. GC-MS trace of aliphatic hydrocarbons (base of lower Aptian).
F39. GC-MS trace of aliphatic hydrocarbons (top of lower Aptian).
F40. Sodium and chloride profiles.
F41. Alkalinity, sulfate, manganese, iron, phosphate, and ammonium profiles.
F42. Potassium, silica, and lithium profiles.
F43. Calcium, magnesium, strontium, barium, and boron profiles.
F44. MST magnetic susceptibility vs. depth, Holes 1207A and 1207B.
F45. MST GRA bulk density vs. depth, Holes 1207A and 1207B.
F46. MST P-wave velocity vs. depth, Hole 1207A.
F47. MST natural gamma radiation vs. depth, Holes 1207A and 1207B.
F48. P-wave velocities from discrete samples vs. depth, Holes 1207A and 1207B.
F49. Water content relative to bulk sediment and solid phase, porosity, and void ratio vs. depth, Holes 1207A and 1207B.
F50. Discrete measurements of P-wave velocities vs. discrete wet bulk density measurements, Hole 1207A.
F51. Whole-core thermal conductivity vs. depth, Holes 1207A and 1207B.
F52. Whole-core thermal conductivity vs. discrete measurements of porosity, Hole 1207A.
F53. Wet bulk, dry, and grain density vs. depth, Holes 1207A and 1207B.
F54. Summary of logging runs, Hole 1207B.
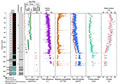
F55. Geophysical logs and equivalent core physical properties measurements, Hole 1207B.
F56. Geochemical logs, Hole 1207B.
F57. Gamma radiation, density, and porosity logs around the OAE1a black shale interval.
F58. Comparison of gamma radiation logs around Cenomian/Turonian boundary.
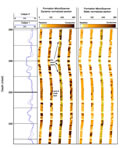
F59. Layered cherts as resistive bands across four pads.
F60. Chert distribution, thickness, and percentage, Hole 1207B.
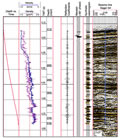
F61. Synthetic seismogram, Hole 1207B.
F62. Synthetic seismogram, seismic line Sager 5A.
T1. Locations, depths, maximum ages, and ages of major unconformities.
T2. Coring summary.
T3. Downhole variation in colors of recovered chert, Hole 1207B.
T4. Results of XRD analyses.
T5. Calcareous nannofossil datums, ages, and depths.
T6. Planktonic foraminiferal datums, ages, and depths.
T7. Distribution of Cretaceous planktonic foraminifers in indurated lithologies.
T8. Neogene benthic foraminifers.
T9. Cretaceous benthic foraminifers.
T10. Concentrations of CH4 in headspace gas.
T11. Carbonate contents, Holes 1207A and 1207B.
T12. Results from CNSH analysis, OAE1a samples.
T13. Organic carbon and Rock-Eval pyrolysis results.
T14. Dominant biomarkers and compound ratios.
T15. Biomarker carbon number ranges and relative abundances.
T16. Biomarker component identities.
T17. Results of geochemical analyses, Hole 1207A.
T18. Discrete index properties measurements.
T19. Discrete measurements of P-wave velocity.
T20. Discrete measurements of thermal conductivity.