![]() Figures F1-F14
Figures F1-F14
![]() Table T1
Table T1
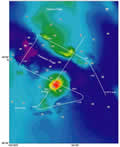
F1. Bathymetric map of Shatsky Rise.
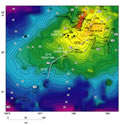
F2. South High survey area.
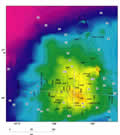
F3. Central High survey area.
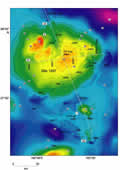
F4. North High survey area.
F5. Thompson Trough survey area on Papanin Ridge.
F6. Seismic data acquisition geometry, sources, and receivers used on Thomas Thompson cruise.
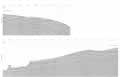
F7. Seismic lines 5A, 5C, and 11B.
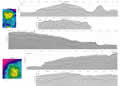
F8. Seismic lines 14A, 14C, 17A, and 17.
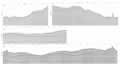
F9. Seismic lines 3 and 4.

F10. Seismic lines 5B, 6, and 7.

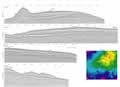
F11. Seismic line 9.
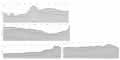
F12. Seismic lines 10, 11A, and 11C.

F13. Seismic lines 12, 13, 14B, and 14C.
F14. Seismic lines 15, 16, 17C, and 17D.
T1. Field acquisition, recording, and processing parameters.