![]() Figures F1-F33
Figures F1-F33
![]() Tables
T1-T20
Tables
T1-T20
F1. Site location map.
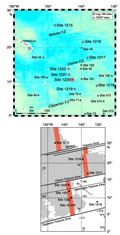
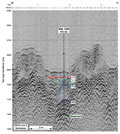
F2. Seismic reflection profile.
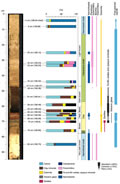
F3. Lithologic summary.
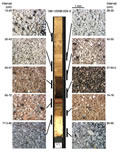
F4. Lithologic and color changes across the P/E boundary sequence.
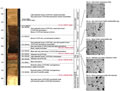
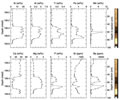
F5. Compositional changes across the P/E boundary sequence.
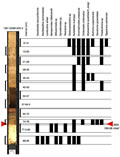
F6. Biostratigraphic zonation.
F7. Photographs of the >63-µm fraction of washed sample from across the P/E boundary.
F8. Stratigraphic distribution of benthic foraminifers.
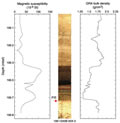
F9. Magnetization intensities after AF demagnetization.
F10. Composite magnetic stratigraphy.
F11. GRA bulk density data plotted vs. composite depth.
F12. Magnetic susceptibility data plotted vs. composite depth.
F13. Spliced records of GRA bulk density, magnetic susceptibility, and color reflectance parameter.
F14. Spliced records of GRA bulk density and magnetic susceptibility.
F15. LSR and chronostratigraphic markers.
F16. Density of Core EW9709-13P compared to density record of Hole 1220A.
F17. Age vs. depth plots for Site 1220 and Core EW9709-13P.
F18. MARs of sediments.
F19. Interstitial water data.
F20. Bulk-sediment data.
F21. CaCO3 and Ca data.
F22. Bulk-sediment data for the P/E boundary.
F23. MAD measurements.
F24. Comparison of MS and GRA density at the P/E boundary.
F25. Wet and dry bulk density plotted with GRA density.
F26. LAS mineralogy determinations.
F27. Compressional wave velocity.
F28. Compressional wave velocity with wet bulk density.
F29. Thermal conductivity.
F30. Thermal conductivity with porosity.
F31. Heat flow calculation.
F32. Natural gamma radiation.
F33. Magnetic susceptibility.
T1. Coring summary.
T2. Distribution of calcareous nannofossil datums.
T3. Distribution of late Paleocene-early Eocene planktonic foraminifers.
T4. Distribution of benthic foraminifers.
T5. Radiolarian first and last occurrences and zonal boundaries.
T6. Composite depths of geomagnetic reversals.
T7. Core disturbance intervals.
T8. Composite depth offsets.
T9. Splice tie points.
T10. Paleomagnetic events.
T11. Nannofossils, foraminifers, and radiolarian events.
T12. Depths, ages, rates, and fluxes of sediments.
T13. Interstitial water data.
T14. Bulk-sediment data.
T15. CaCO3 and Corg data.
T16. Moisture and density measurements.
T17. LAS-based mineralogy.
T18. Split-core velocity measurements.
T19. Thermal conductivity.
T20. In situ temperature.