![]() Figures F1-F24
Figures F1-F24
![]() Tables
T1-T8
Tables
T1-T8
F1. Site 1227 survey.
![]()
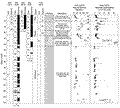
F2. Lithostratigraphic summary.
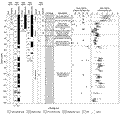
F3. Lithostratigraphy with magnetic susceptibility and NGR.
F4. Site 1227 features.
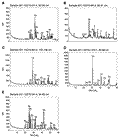
F5. X-ray diffractograms.
F6. Dissolved species in interstitial waters.
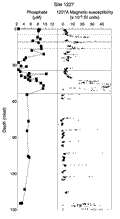
F7. Lithostratigraphy, magnetic susceptibility, and phosphate.
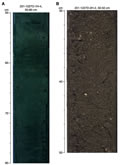
F8. Subsampling for MBIO sections, Hole 1227A.
![]()
F9. Subsampling for MBIO sections, Hole 1227D.
![]()
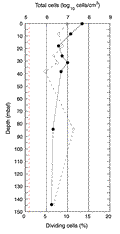
F10. Prokaryotic cells enumerated.
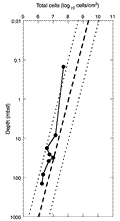
F11. Total prokaryote profile.
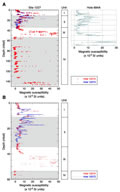
F12. Comparison of magnetic susceptibility data.
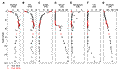
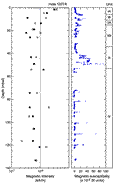
F13. Magnetic intensity and susceptibility.
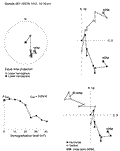
F14. Principal component analysis of NRM.
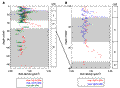
F15. Comparison of GRA density.
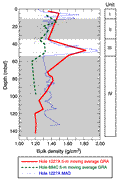
F16. Comparison of GRA and MAD density.
F17. MAD measurements.
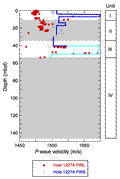
F18. P-wave velocity profiles.
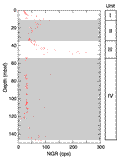
F19. NGR profile.
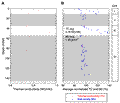
F20. Thermal conductivity measurements.
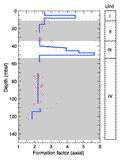
F21. Formation factor profile.
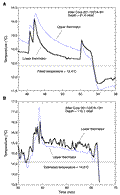
F22. DVTP temperature records.
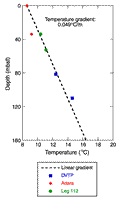
F23. Temperatures vs. depth.
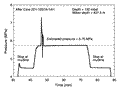
F24. DVTP-P pressure record.
T1. Coring summary.
T2. Dissolved species in interstitial waters.
T3. Hydrocarbons in headspace.
T4. Calculated interstitial water hydrogen.
T5. Seawater contamination based on PFT.
T6. Potential contamination of slurries based on PFT.
T7. Media inoculated with material from Site 1227.
T8. Temperature measurements.