![]() Figures
F1-F8
Figures
F1-F8
![]() Tables T1-T3
Tables T1-T3
F1. DSDP Leg 18, ODP Legs 146 and 204, and IODP Expedition 311 sites.
F2. Leg 204 sites.
F3. SHR seismic profile, section, and slice.
F4. Methane concentrations, production rates, and composition.
![]()
F5. Horizon A properties.
![]()
F6. Nested view of data from Horizon B in Hole 1246B.
![]()
F7. Lateral variability among holes at the same site.
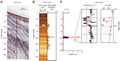
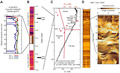
F8. Gamma density and IR image of a HYACINTH pressure core and Cl– and RAB data.
T1. Leg 204 site summaries.
T2. Average hydrate contents.
T3. Thermal gradients and heat flow.
![]() Figures F1-F8
Figures F1-F8
![]() Tables T1-T3
Tables T1-T3