![]() Figures F1-F30
Figures F1-F30
![]() Figures
F31-F60
Figures
F31-F60
![]() Figures
F61-F90
Figures
F61-F90
![]() Figures
F91-F118
Figures
F91-F118
![]() Tables
T1-T13
Tables
T1-T13
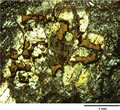
F91. Vermicular spinel in protogranular harzburgite.
F92. True-scale cross-section showing structural features.
F93. Recovery plots showing location of major fault zones.
F94. H2O, SiO2, and Fe2O3 vs. MgO and H2O vs. SiO2.
F95. CaO vs. Al2O3 in peridotites.
F96. CaO vs. CO2 in peridotites.
F97. Sr vs. Al2O3 in peridotites.
F98. TiO2, Zr, V, and Sc vs. Al2O3 in peridotites.
F99. Ni and Cr vs. Al2O3 in peridotites.
F100. MgO, Al2O3, and H2O vs. SiO2 in gabbros.
F101. Fe2O3 vs. TiO2 in gabbros.
F102. TiO2 and Cr vs. SiO2 in gabbros.
F103. V and Zr vs. TiO2 for gabbros.
F104. Sc vs. V and Zr vs. Y for gabbros.
F105. MST magnetic susceptibility.
F106. Thermal conductivity.
F107. Apparent thermal conductivity anisotropy.
F108. Apparent thermal conductivity anisotropy in one sample.
F109. P-wave velocity vs. wet bulk density.
F110. Demagnetization of archive halves, Hole 1270B.
F111. Demagnetization of discrete samples, Hole 1270B.
F112. Normalized magnetization decay curves of discrete samples.
F113. Demagnetization of discrete samples, Holes 1270C and 1270D.
F114. Paleomagnetic inclinations.
F115. Remanent declination from discrete samples and archive halves.
F116. Rose diagram of paleomagnetic declinations.
![]()
F117. Projections of minimum eigenvector of the susceptibility tensor.
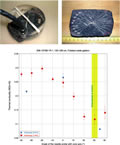
F118. PFT in standards and core pieces.
![]() Figures F1-F30
Figures F1-F30
![]() Figures
F31-F60
Figures
F31-F60
![]() Figures
F61-F90
Figures
F61-F90
![]() Figures F91-F118
Figures F91-F118
![]() Tables
T1-T13
Tables
T1-T13