![]() Figures
F1-F12
Figures
F1-F12
![]() Table T1
Table T1
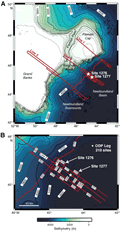
F1. Bathymetric maps of the Newfoundland margin.
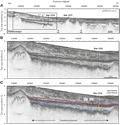
F2. Prestack time migration of SCREECH Line 2.
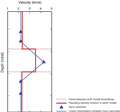
F3. Vertical and horizontal P-wave velocity and density.
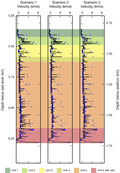
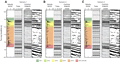
F4. Three scenarios for processing physical property measurements.
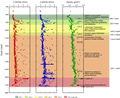
F5. Creation of earth model.
F6. Velocity functions used to calculate reflection coefficient series.
F7. Estimates of seismic source wavelet.
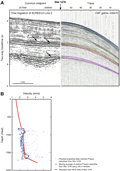
F8. Velocity modeling of MCS reflection data.
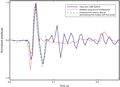
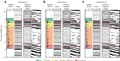
F9. Synthetic seismograms for Scenarios 1, 2, and 3.
F10. Three interpretations for Scenario 3 synthetic seismogram.
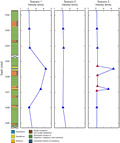
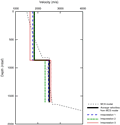
F11. Comparison of velocities above and below Unit 1/2 boundary.
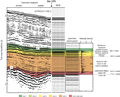
F12. Seismic horizons on a section of SCREECH Line 2.
T1. TWT and average velocities.
![]() Figures F1-F12
Figures F1-F12
![]() Table T1
Table T1